Economic Strategy & Impact Tool
Data-driven insight for every community in British ColumbiaPinpoint sector strengths • forecast ripple-effects • unlock grant funding—all in one interactive workspace.
What will I gain?
Your Task |
How Economic Strategy & Impact Tool Helps |
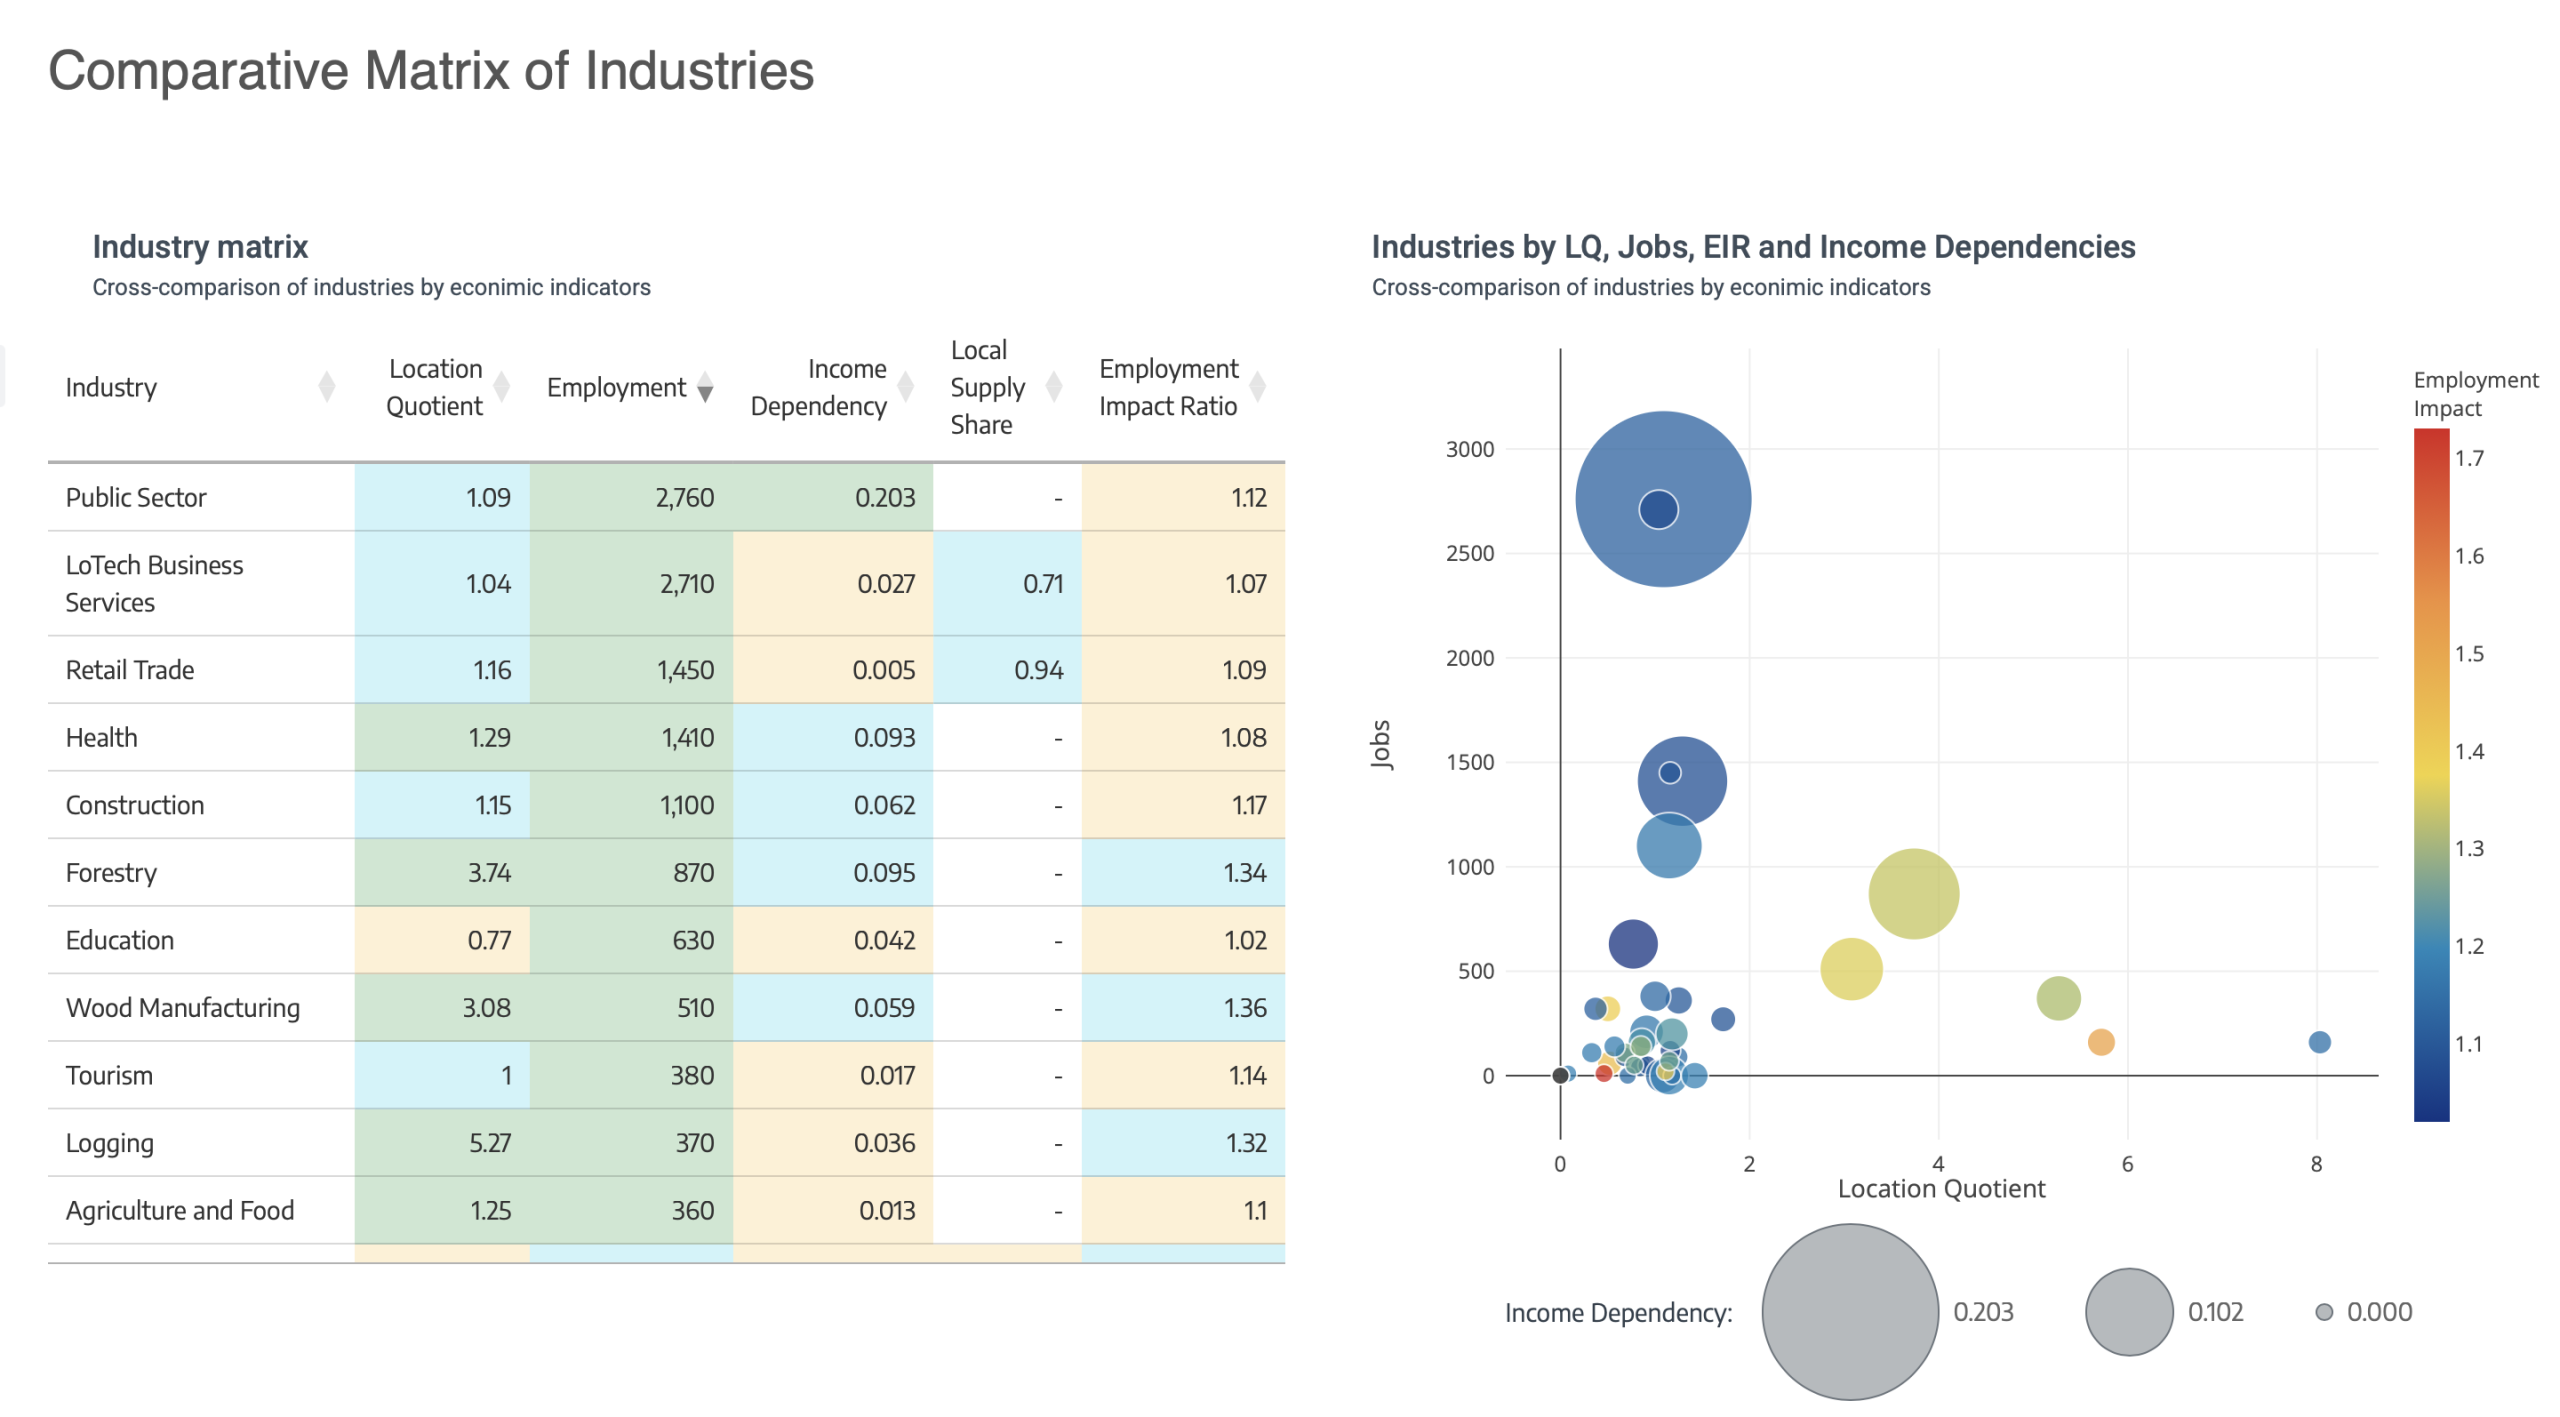
| Council or Board briefing | One-screen Industry Matrix reveals at-a-glance which sectors are concentrated, growing, or vulnerable. |
| Prioritize investments & policy | Strategy Recommendations instantly tell you whether which sectors are good candidates for Diversification, Strengthening or Recovery economic strategy. |
| Prove impact for grant applications | Employment Impact Calculator converts job estimates into total economic benefit. |
| Engage stakeholders | Intuitive heat-maps & bubble charts turn complex data into clear talking points everyone can grasp. |
Trusted by organizations across British Columbia

Regional Districts
Detailed insights into advanced economic indicators at Regional District level.
See examples:
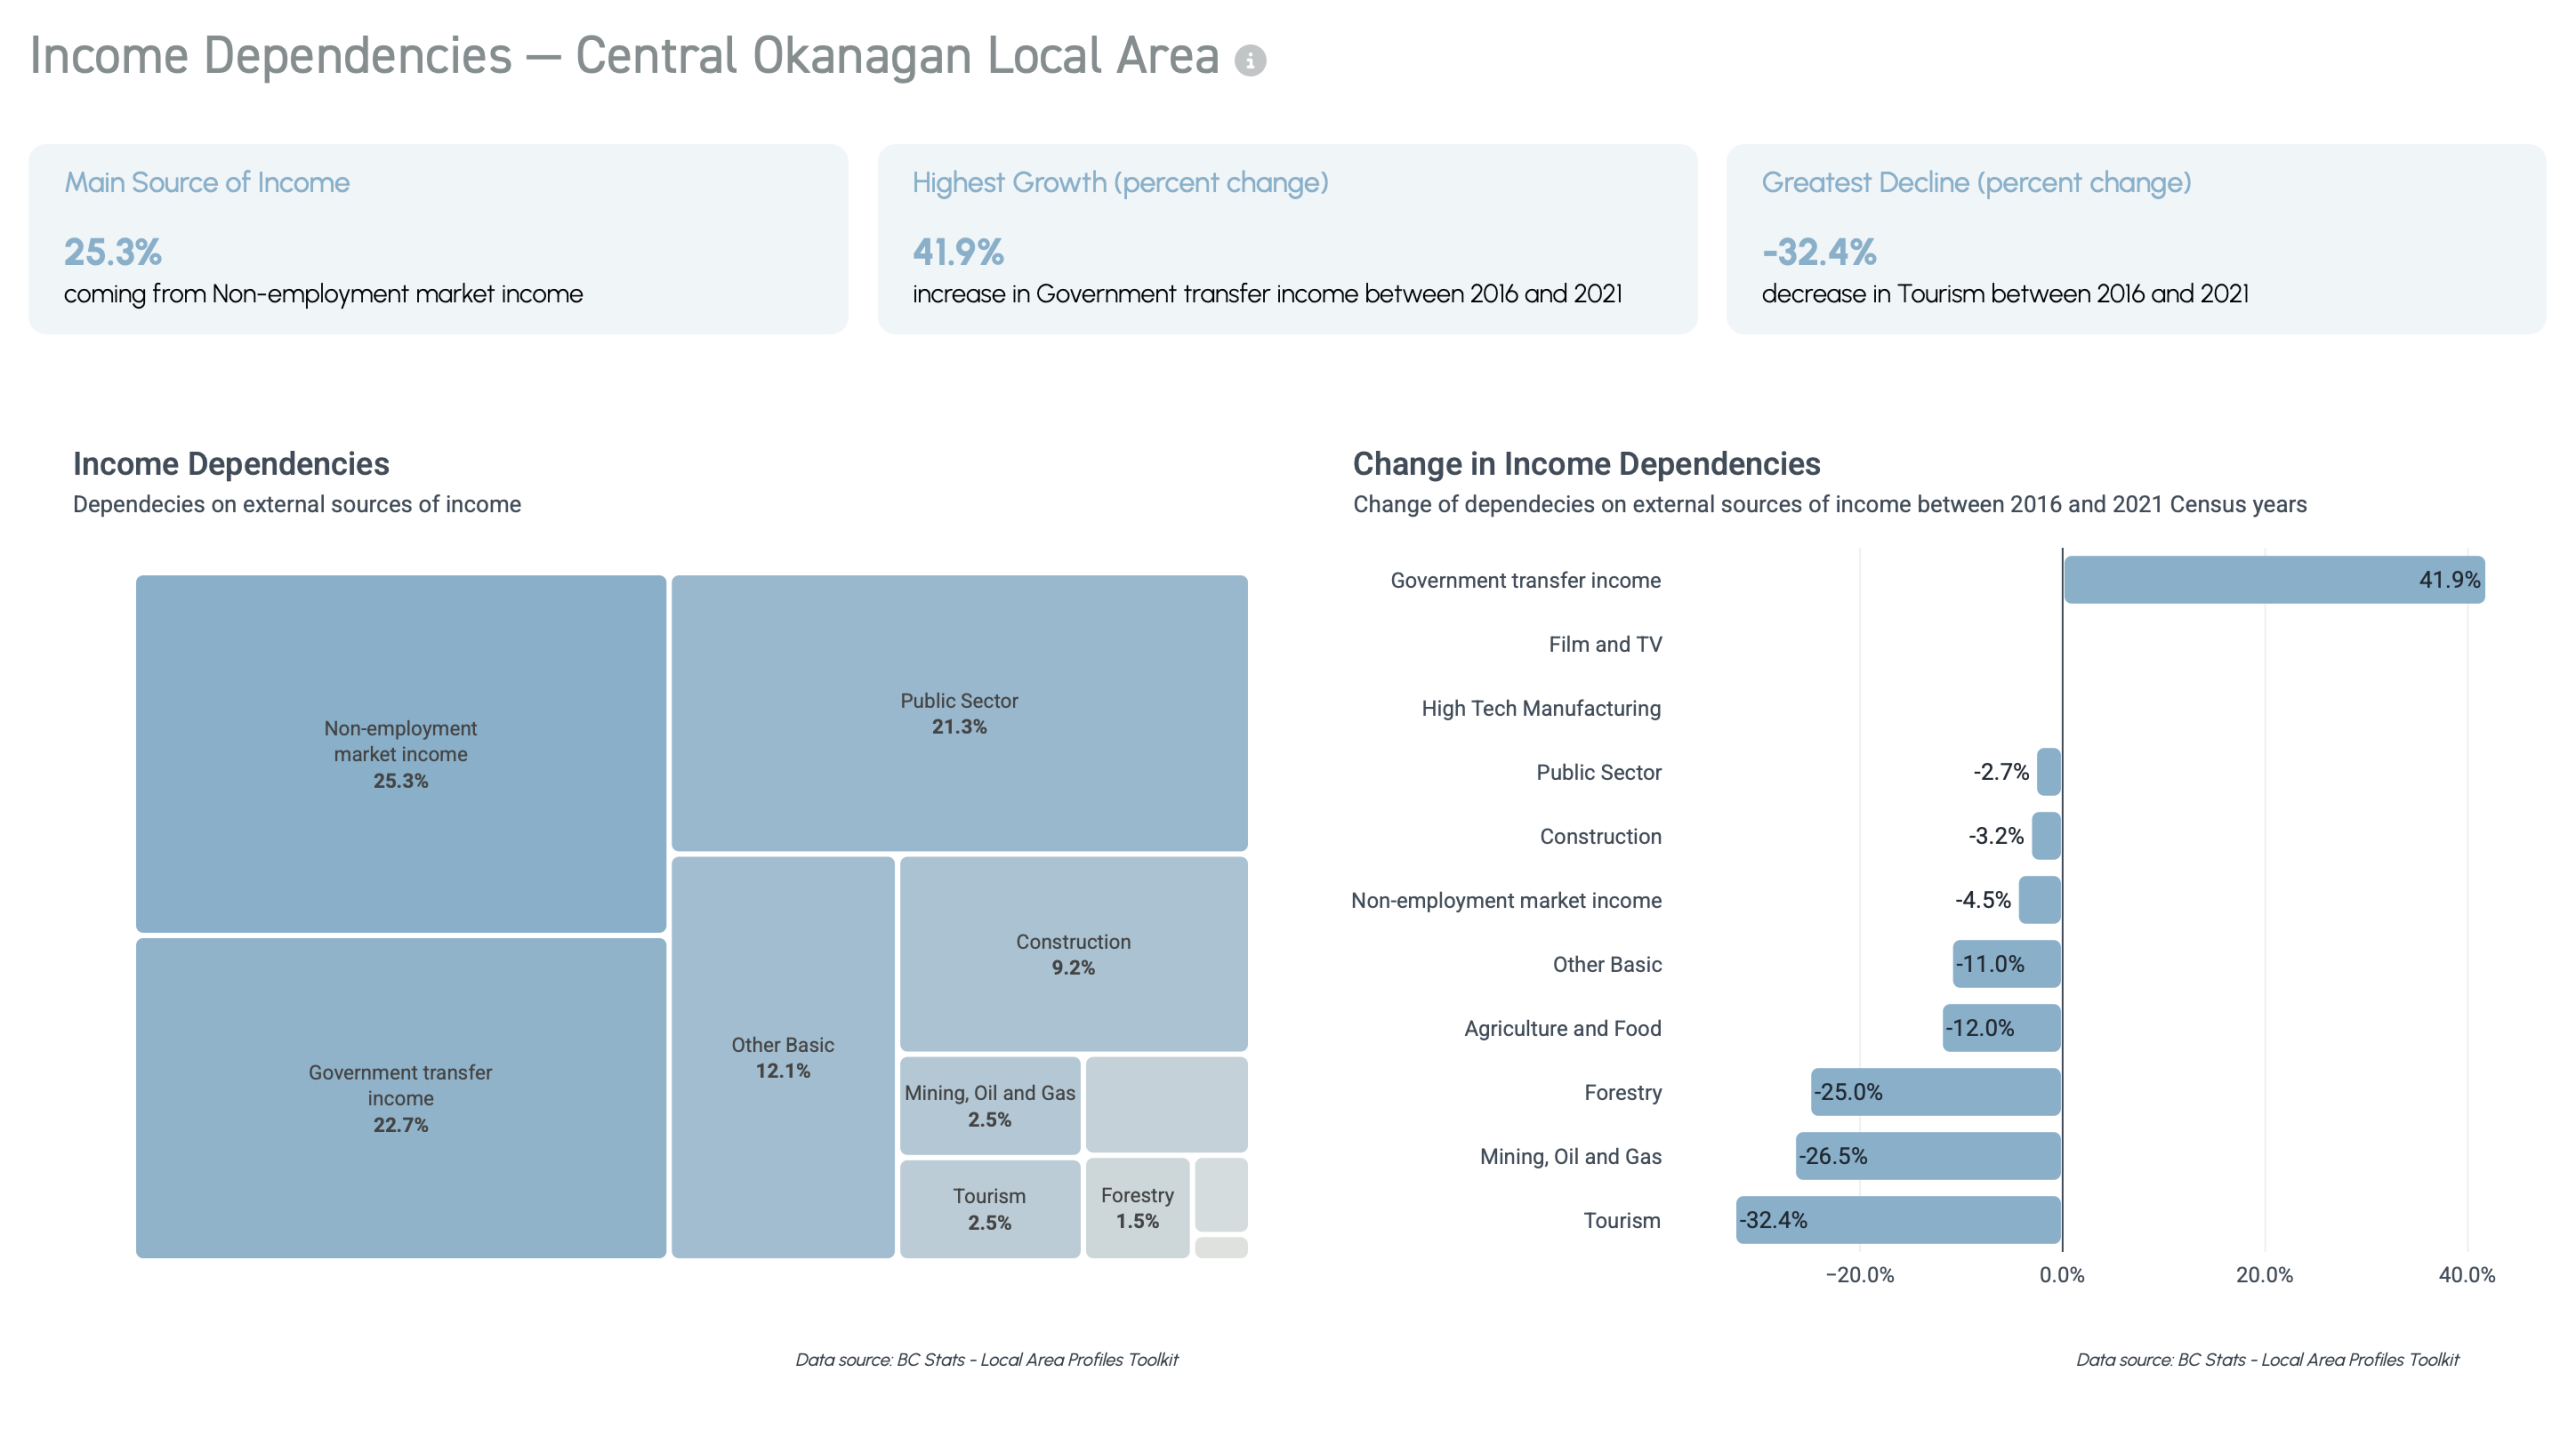
Central Okanagan • Northern Rockies

Municipalities
Local insights in the hands of economic developers, elected officials, investors and general public.
See examples:
Port Alberni • Cranbrook • Langley City

Chambers of Commerce
Support your business community and help them uncover business opportunities.
See examples:
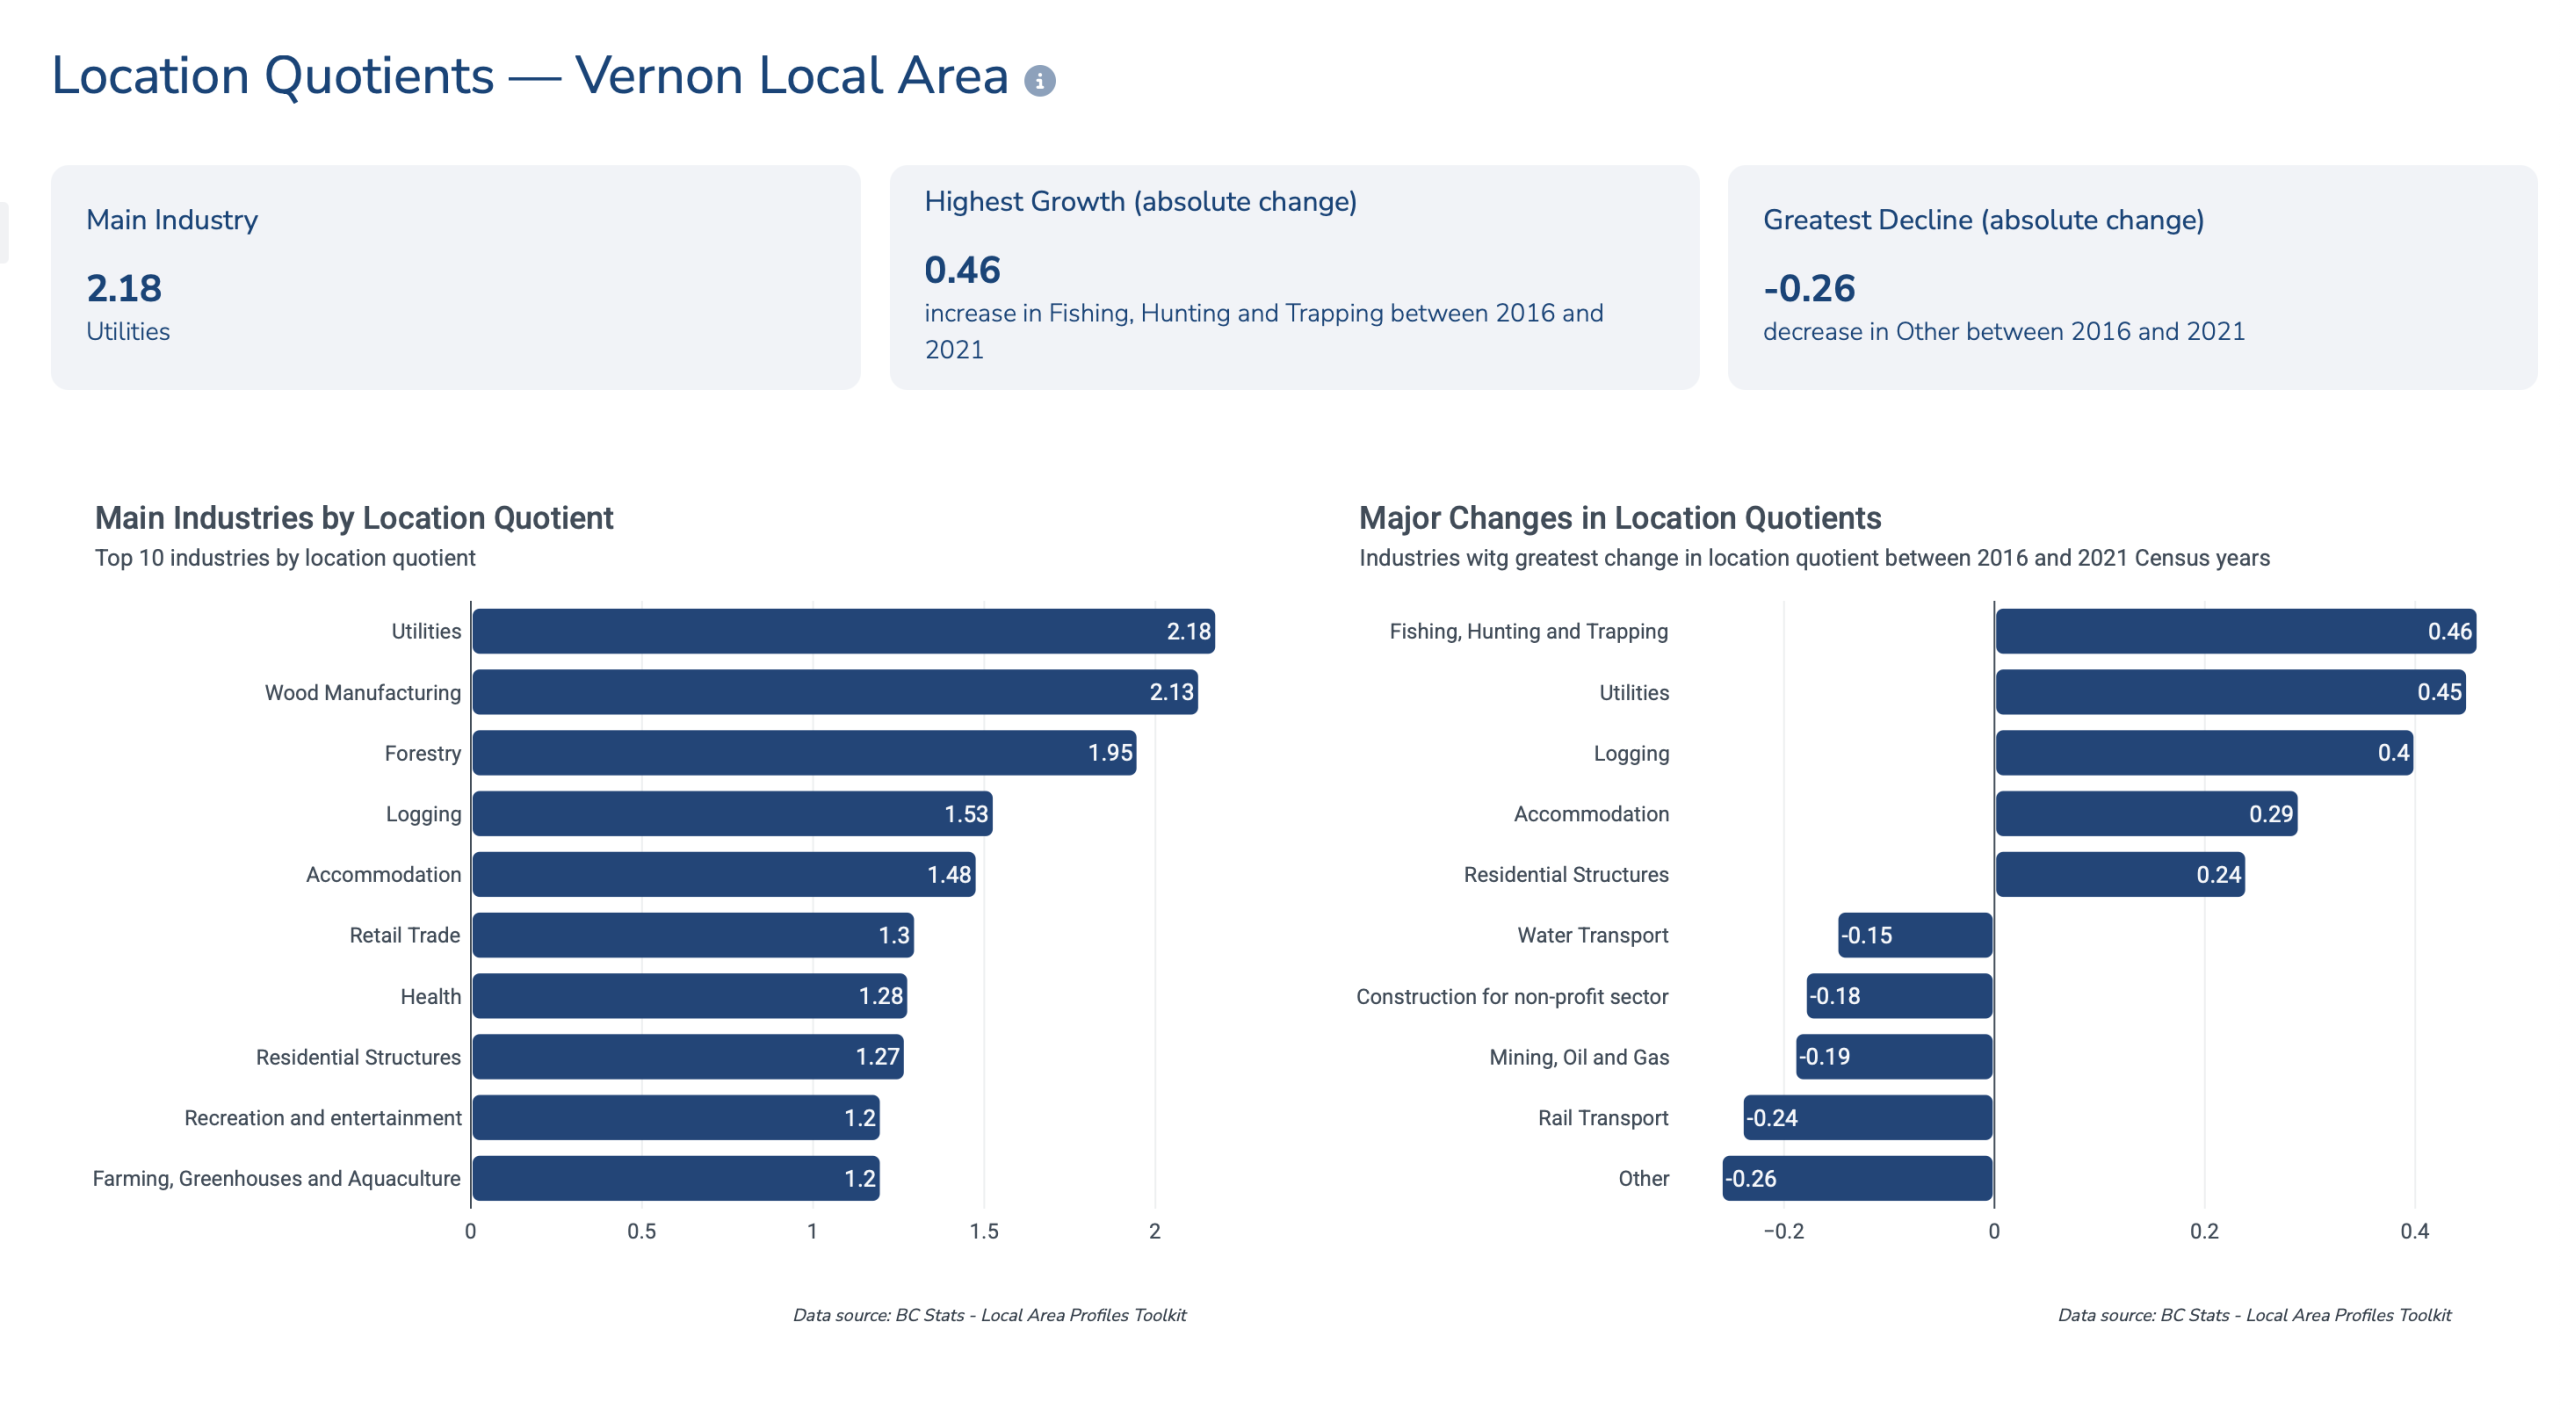
Greater Vernon Chamber of Commerce

Regional Organizations
Regional organizations with custom boundaries can support communities in their service area.
See examples:
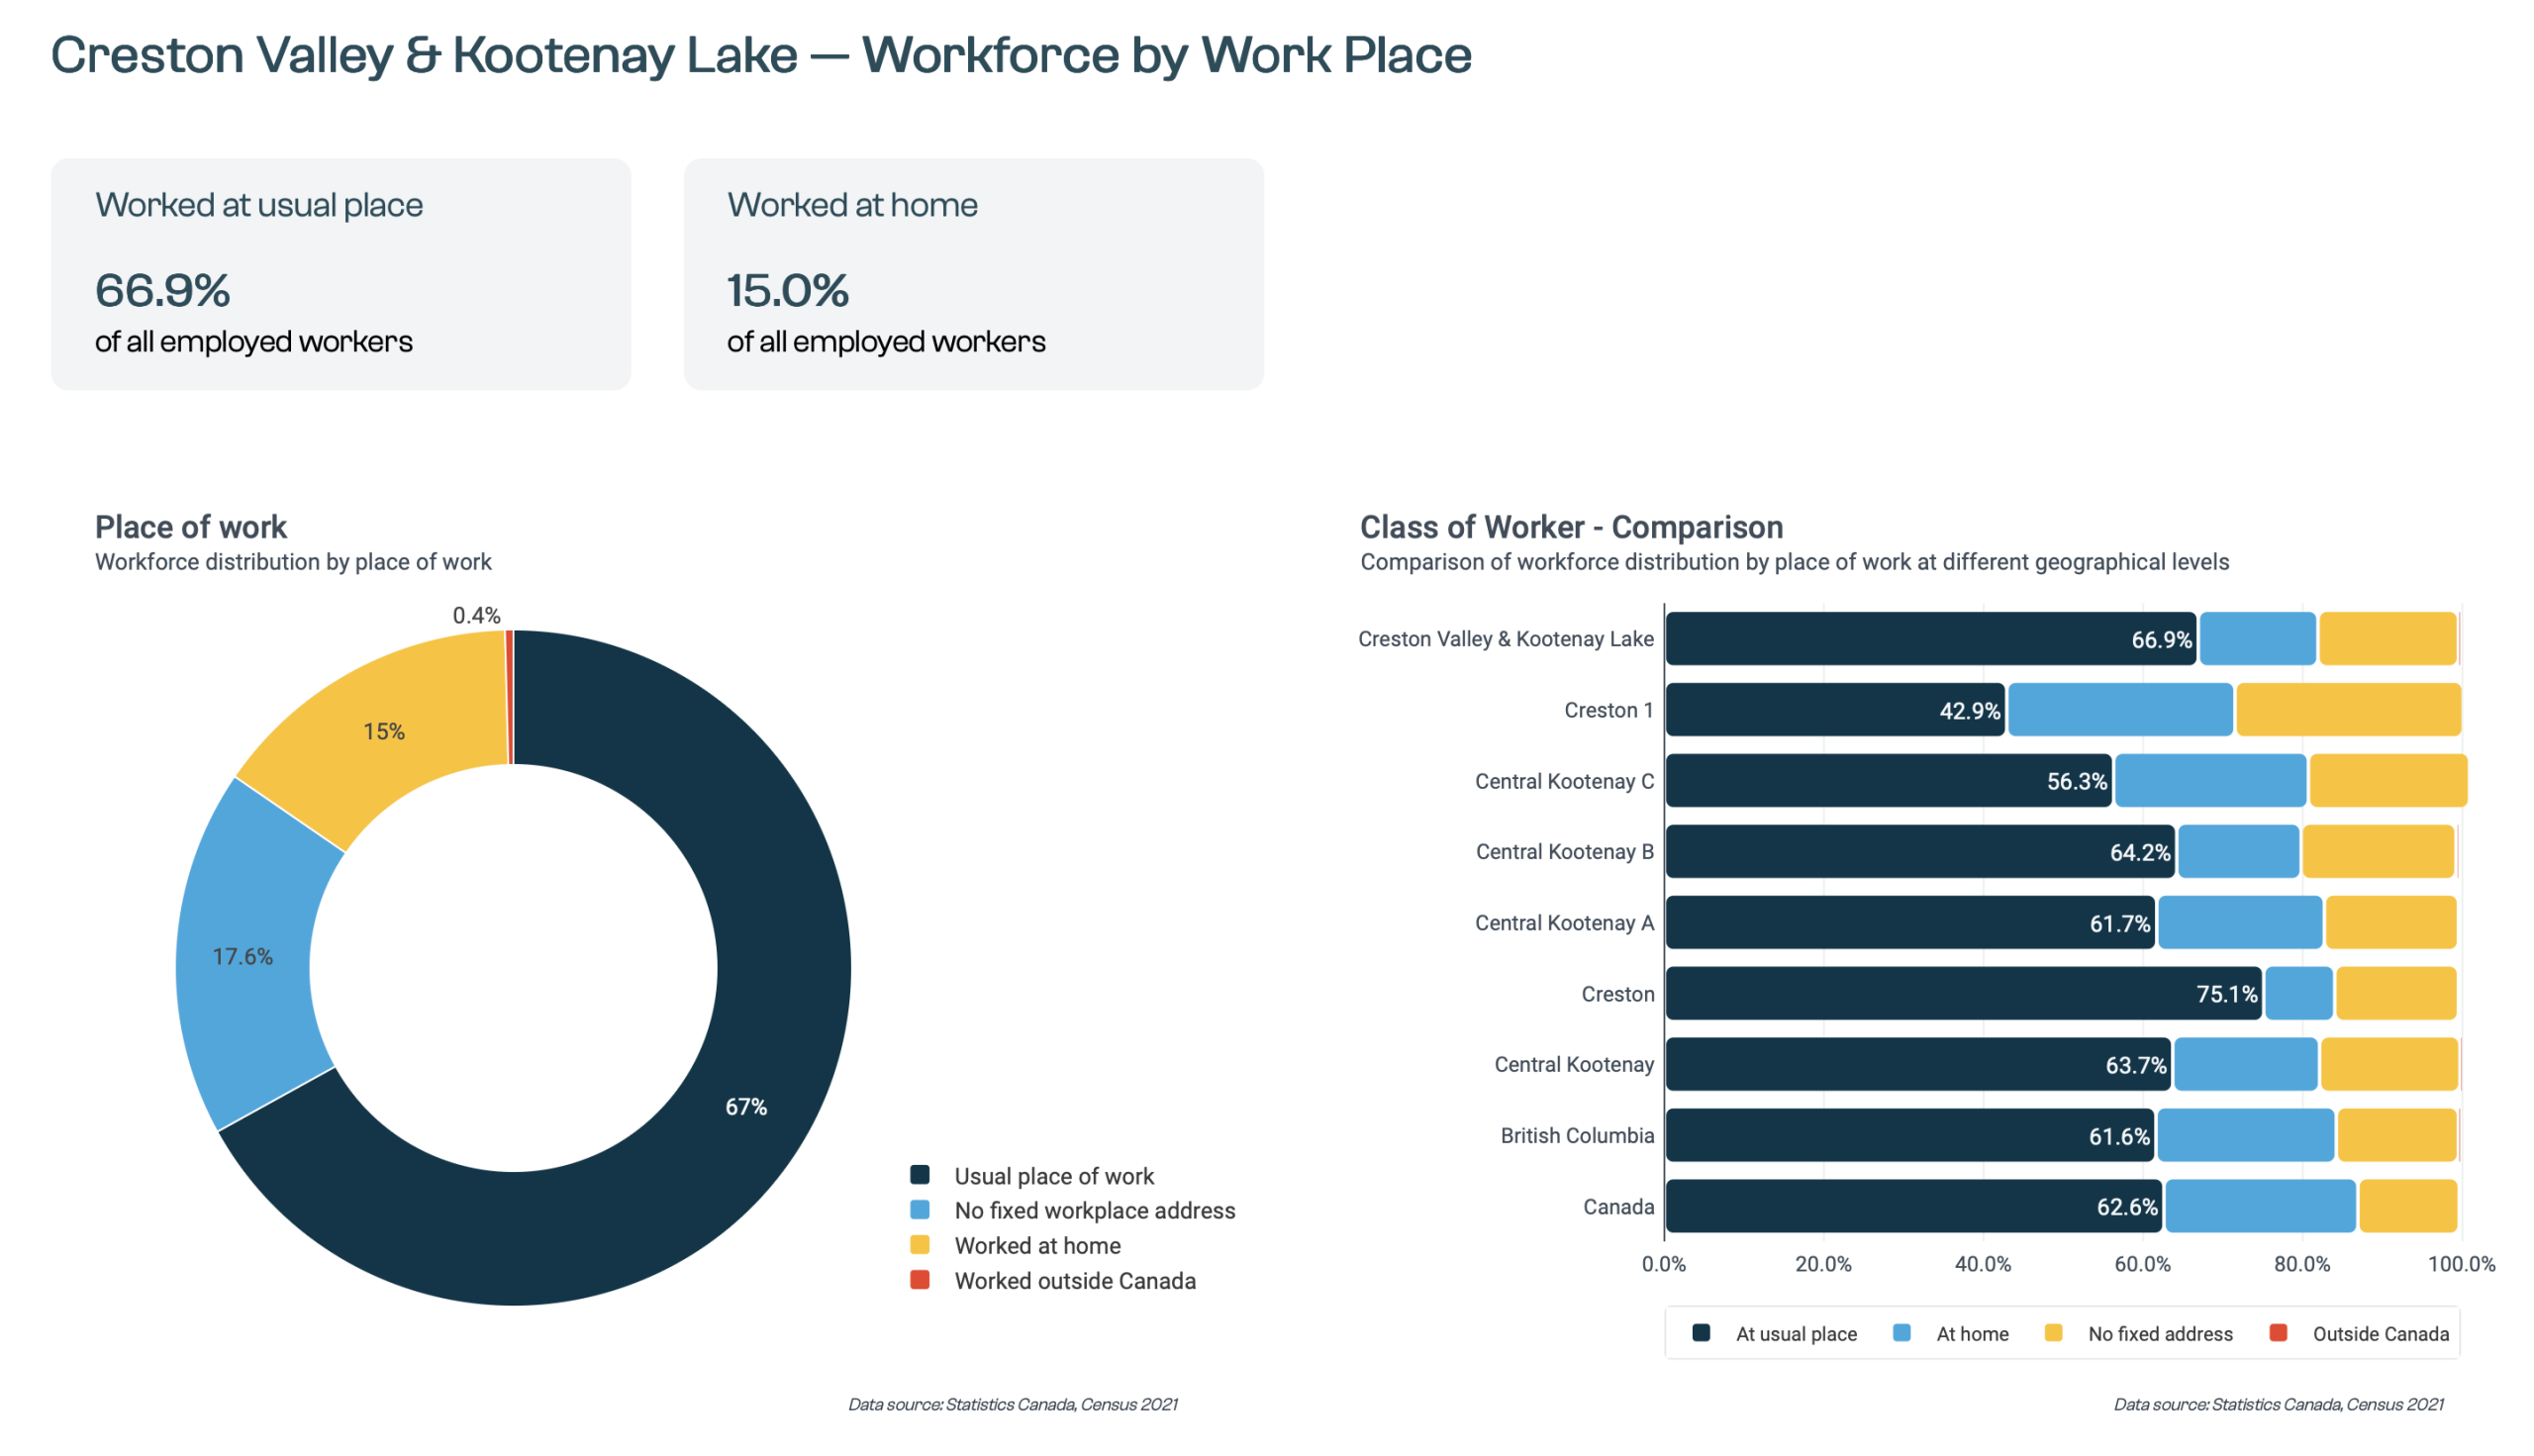
Kootenay Employment Services
Core Economic-Dependencies Dataset
Data
BC macroeconomic model (Input-Output Tables) applied on top of Census 2021 and 2016.
Level of detail
All Regional Districts and 103 Local Areas.
The 103 local areas were assembled by BC Stats with the intention of selecting meaningful economic units. They are aggregations of one or more census subdivisions, which include municipalities, Electoral Areas and First Nations.
Advanced indicators included for every user
Indicator |
What it answers |
| Industry Diversity Index | Is our economy broad=based or highly specialized? |
| Location Quotient | Do we rely on this sector more than the BC average? |
| Employment Impact Ratios | How many indirect and induced jobs per direct job? |
| Income Dependencies | What income sources (wages, transfers, other) sustain us? |
| Local Supply Shares | Are we net importers or exporters of key services? |
Typical questions solved in minutes
- Which industries out-perform or lag provincial benchmarks?
- How can investors or grant reviewers understand our economy at a glance?
- How diverse is our economic base?
- What if there’s a forestry downturn—how exposed are we?
- How is employment by industry shifting since 2016?
- How does our population growth compare with neighbours?
- What makes us unique in a regional context?
Premium Feature Spotlight
1. Industry Matrix
Colour-coded heat-map of LQ, employment, supply-chain share, income dependence for 40+ sectors by NAICS code.
Visualize Location Quotient vs. employment vs income dependency vs employment impact ratio. Spot outliers fast.
2. Strategy Recommendations
Rules engine classifies sectors into Diversification, Strengthening, Recovery buckets. Advanced filters let you refine the shortlist before it hits the council agenda.
3. Employment Impact Calculator
Enter direct jobs gained/lost in a sector → see local indirect & induced effects plus income impact. Perfect for grant applications, understanding the impact of major changes in local employment, and “what-if” analyses.
Built for
- Economic Development Officers & Planners
- Councillors & Regional Directors
- Grant-writers & consultants
- Chief Administrative Officers (CAOs)
Success Story
“…Altogether, the Economic Dependencies section of the CityViz data portal has emerged as one of our most used tools. In the two and a half months since the data became available, we have used it for grant applications, the master plan for another municipal department and orientation sessions with Council…”
— Pat Deakin, Economic Development Manager, Port Alberni
AI-Powered Key Insights
Automated interpretations of trends and changes across regions and local areas powered by AI.
Easy Benchmarking
Easily benchmark regions and areas against both regional and provincial averages.
Contextual Navigation
Intuitive switching between topics and indicators and dynamic charts for seamless data exploration.


