Economic Indicators Dashboard
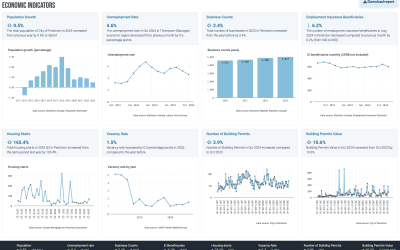
Provide investors, developers, new and existing businesses with real-time insights provided by Economic Indicators Dashboard embeddable website widget and data portal module to boost investment attraction and economic development.
- Population growth
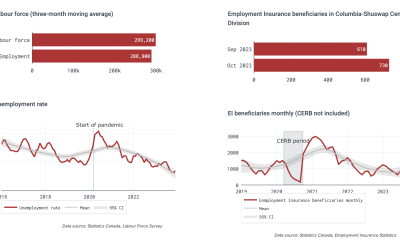
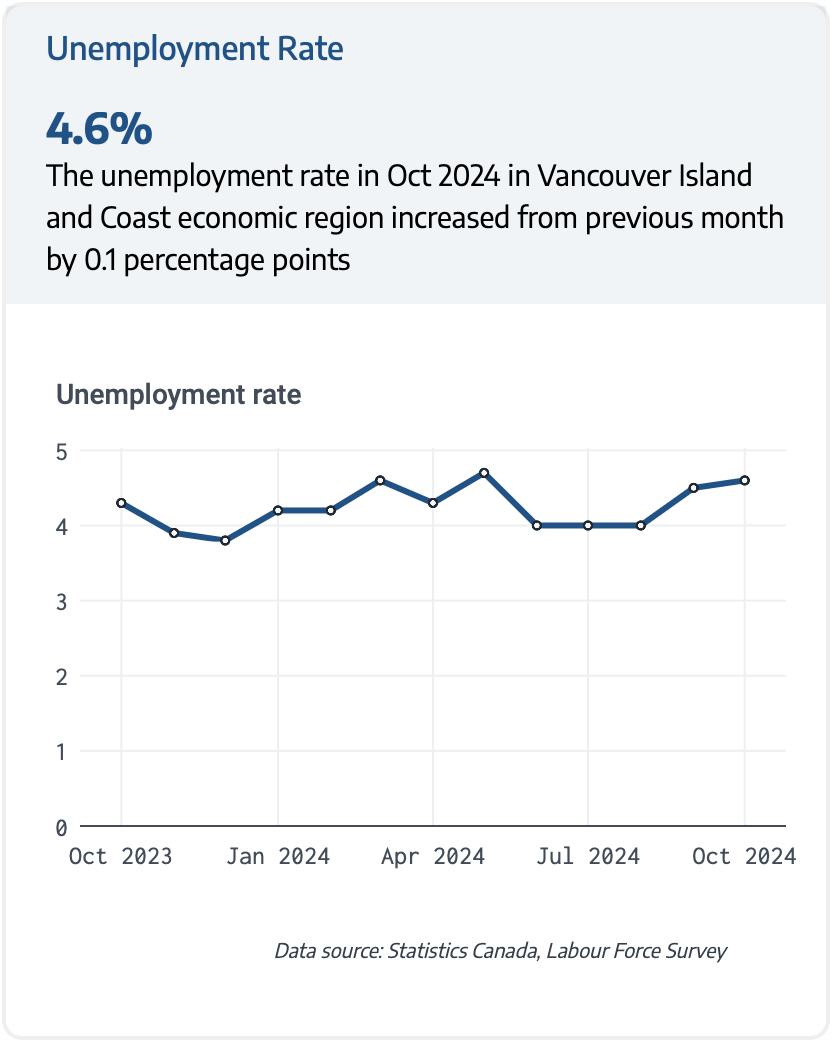
- Unemployment & employment rates
- Business counts
- Housing starts
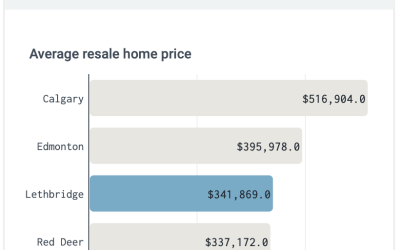
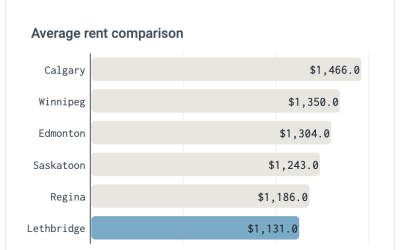
- Average rent comparison
- Building permits
- Business licences
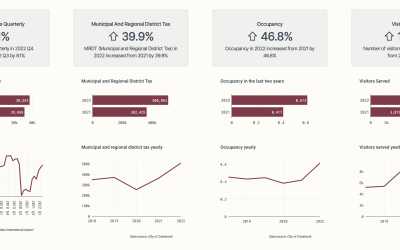
- Tourism data
- Custom data, and more.
Current Values and Trends Visualization
View the latest data points of crucial economic indicators and track their trends over time, offering a clear, current snapshot of your economy’s health and direction.
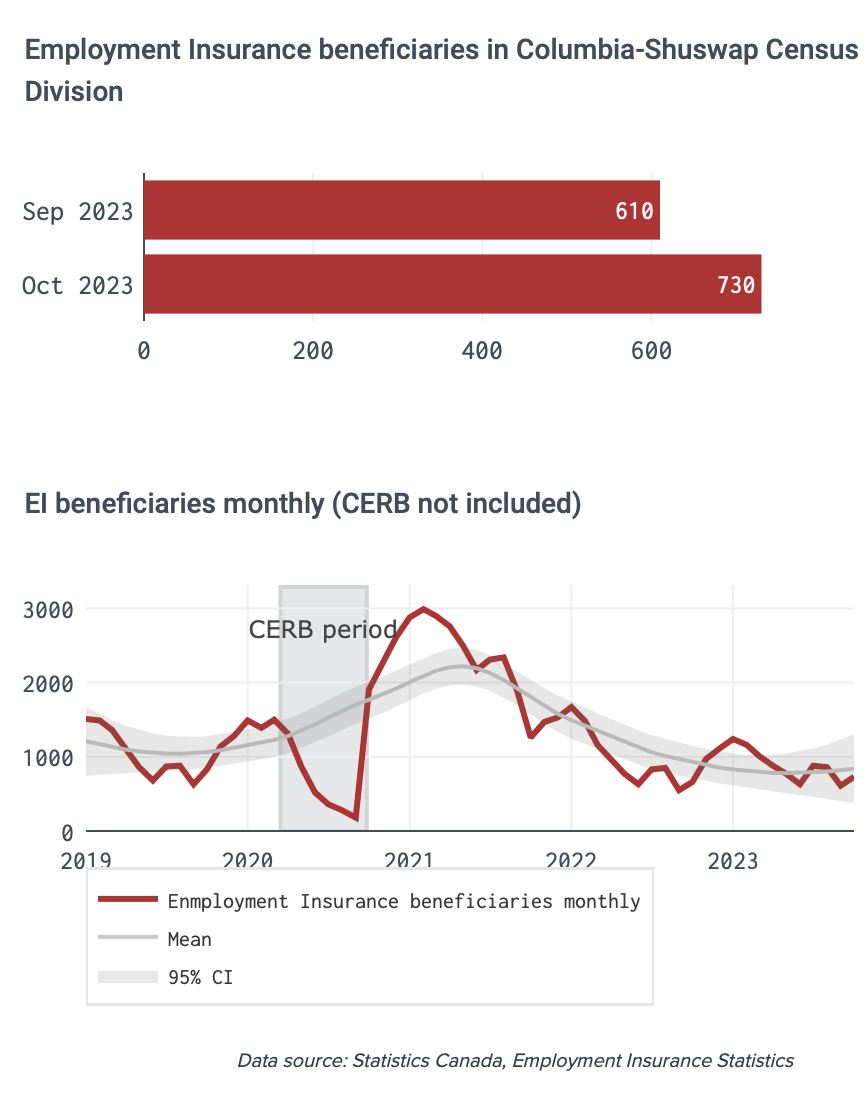
Visual Storytelling
Understand the ‘why’ behind the numbers with annotated charts that highlight major events or factors contributing to sudden shifts or trends in indicator values, providing a narrative that complements the data.
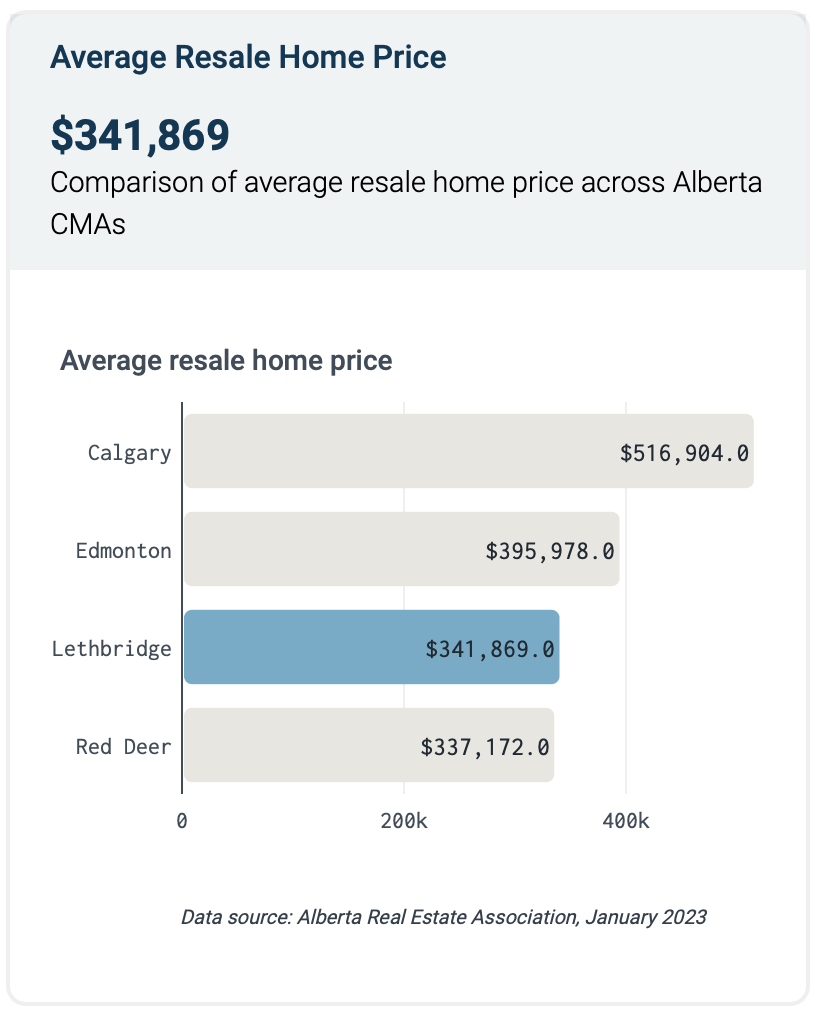
Benchmarking and Comparative Analysis
Gain a competitive edge by benchmarking your economic indicators against those of other cities or locations. Engage in a comparative analysis to understand your standing, identify opportunities, and strategize with a broader perspective.
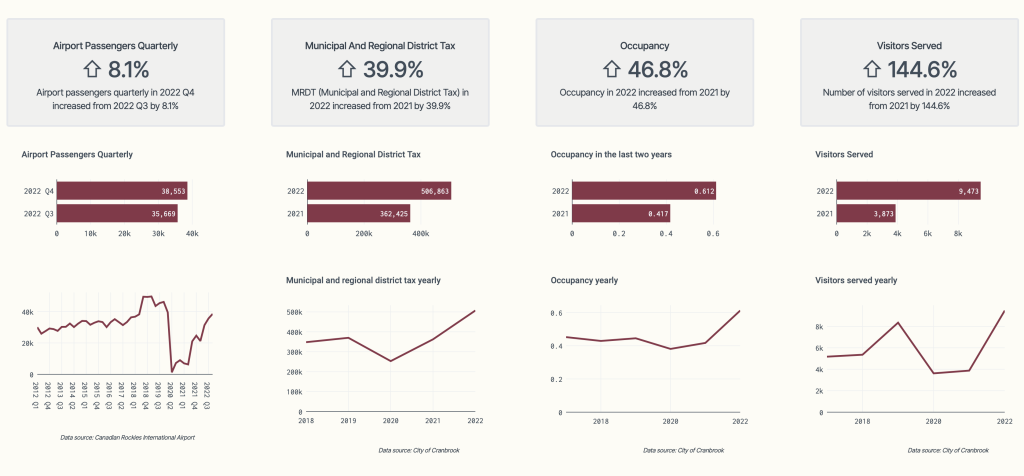
Customization and Data Integration
Tailor the dashboard to reflect your unique needs and perspectives by incorporating your own data sets. Customize the visualization and analysis to align perfectly with your strategic objectives.
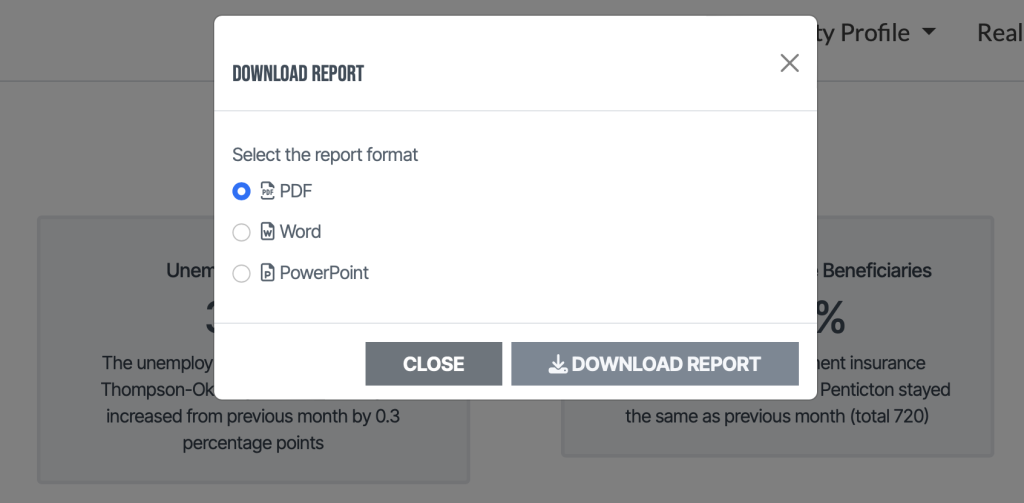
Downloadable Reports
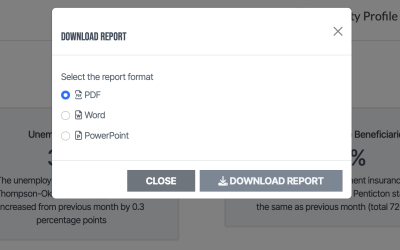
Transform your dashboard insights into actionable reports. With just a few clicks, users can download comprehensive reports in PDF, Word, or PowerPoint formats, ensuring that stakeholders can access and share critical information effortlessly.
CityViz Economic Indicators Dashboard
With its real-time data, contextual insights, customization capabilities, downloadable reports, and comparative analysis features, economic development dashboard is a strategic asset. Enable your organization to visualize, analyze, and communicate the economic narrative of your community or region effectively. With CityViz, transform data into decisions, and insights into action. Checkout economic indicators dashboard in action.
