Embeddable Website Widgets
Get your data working in the right place to support your marketing efforts. The list of our embeddable website widgets is growing, here is a selection of the most popular ones.
Workforce Profile
Community Profile
Business Directory Map
Business Landscape
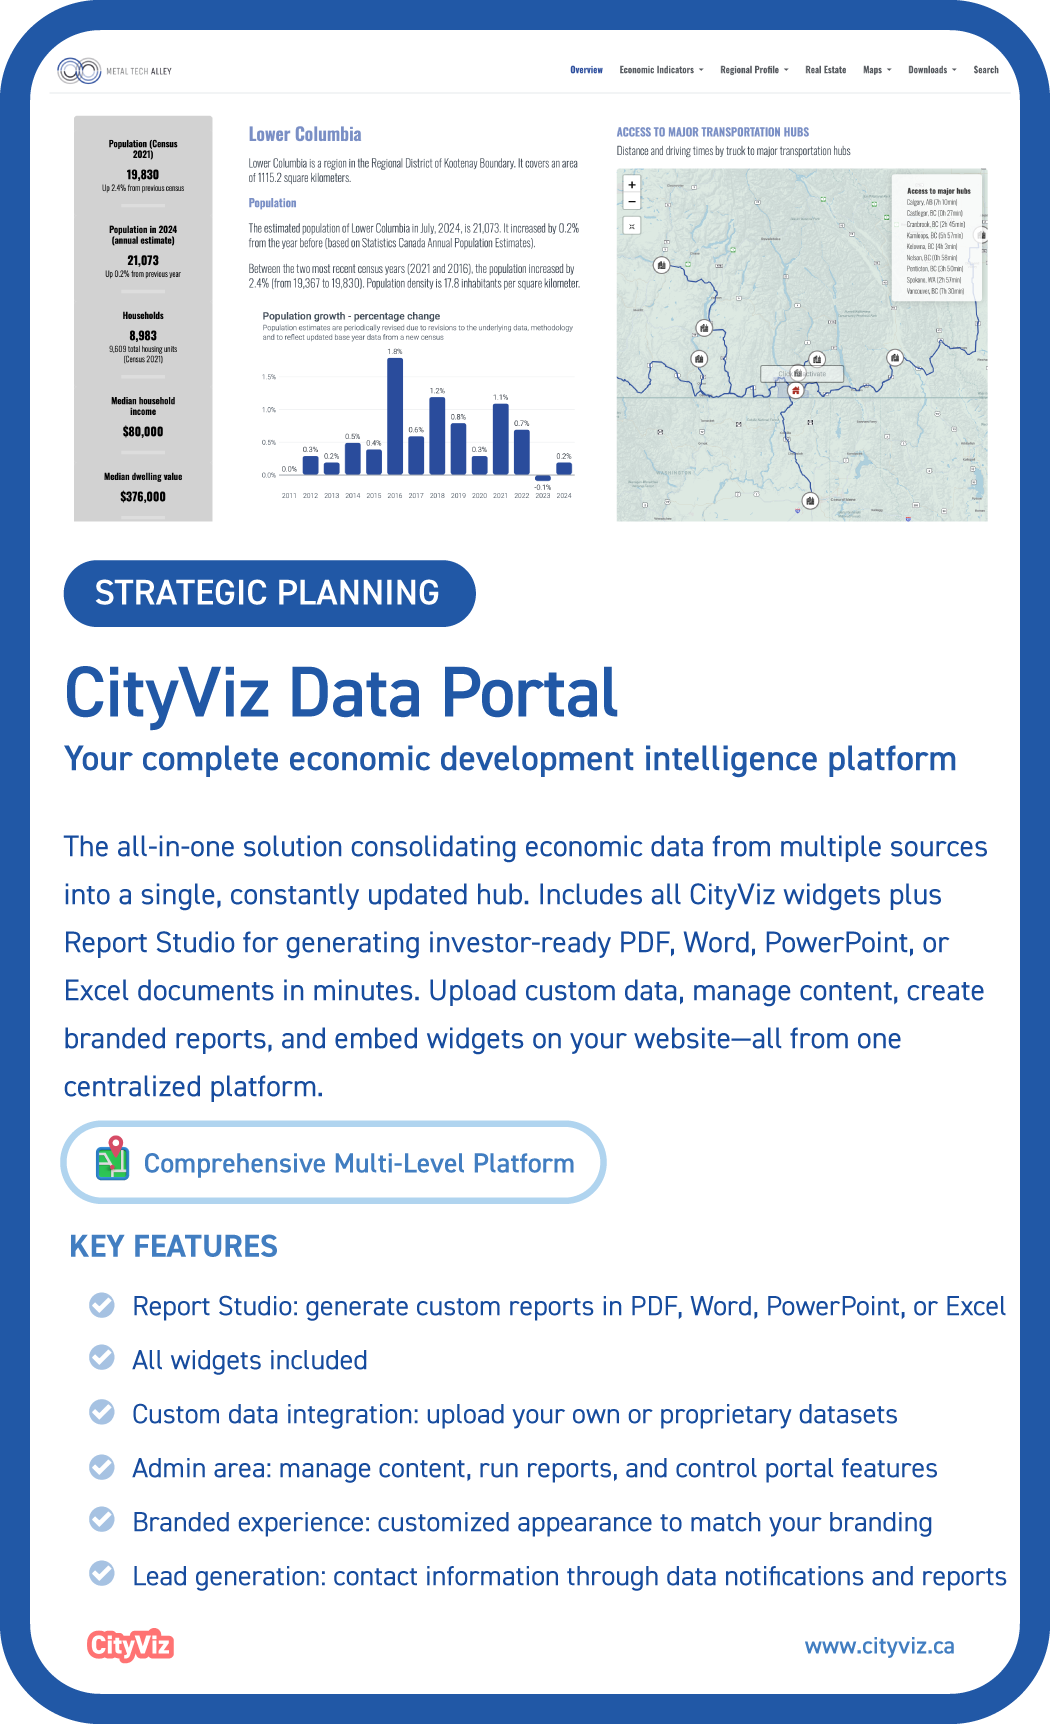
CityViz Data Portal
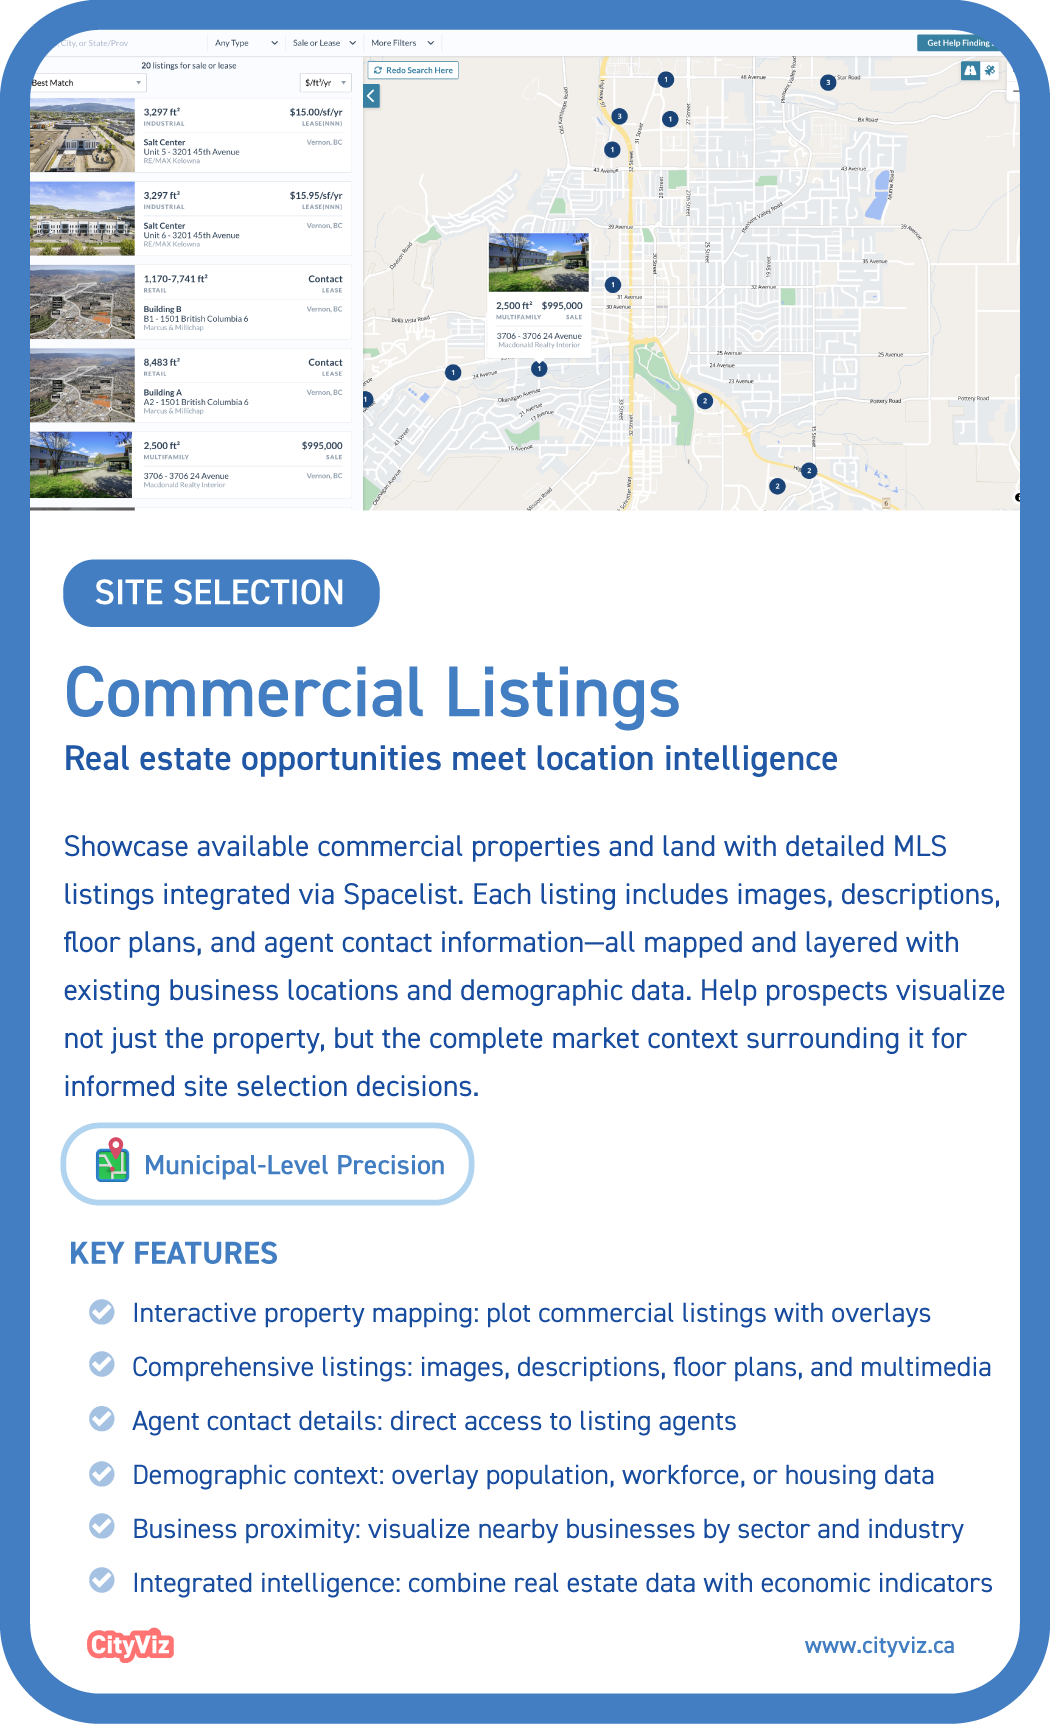
Commercial Listings
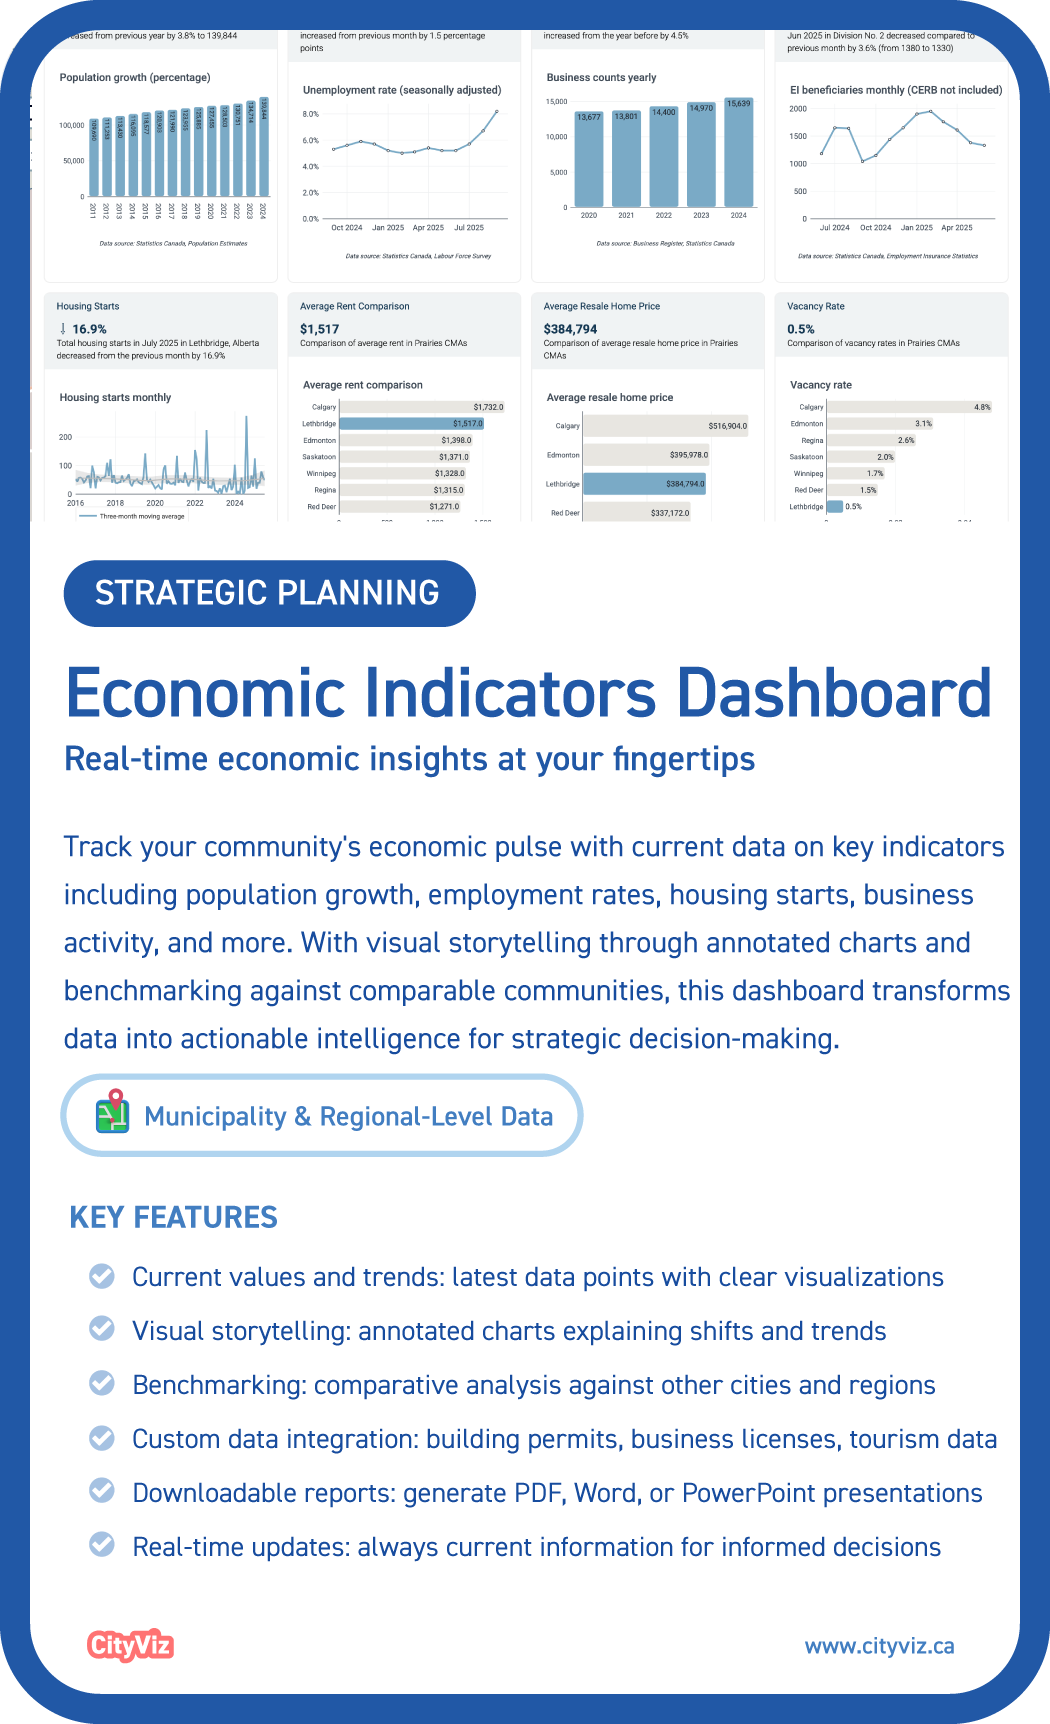
Economic Indicators
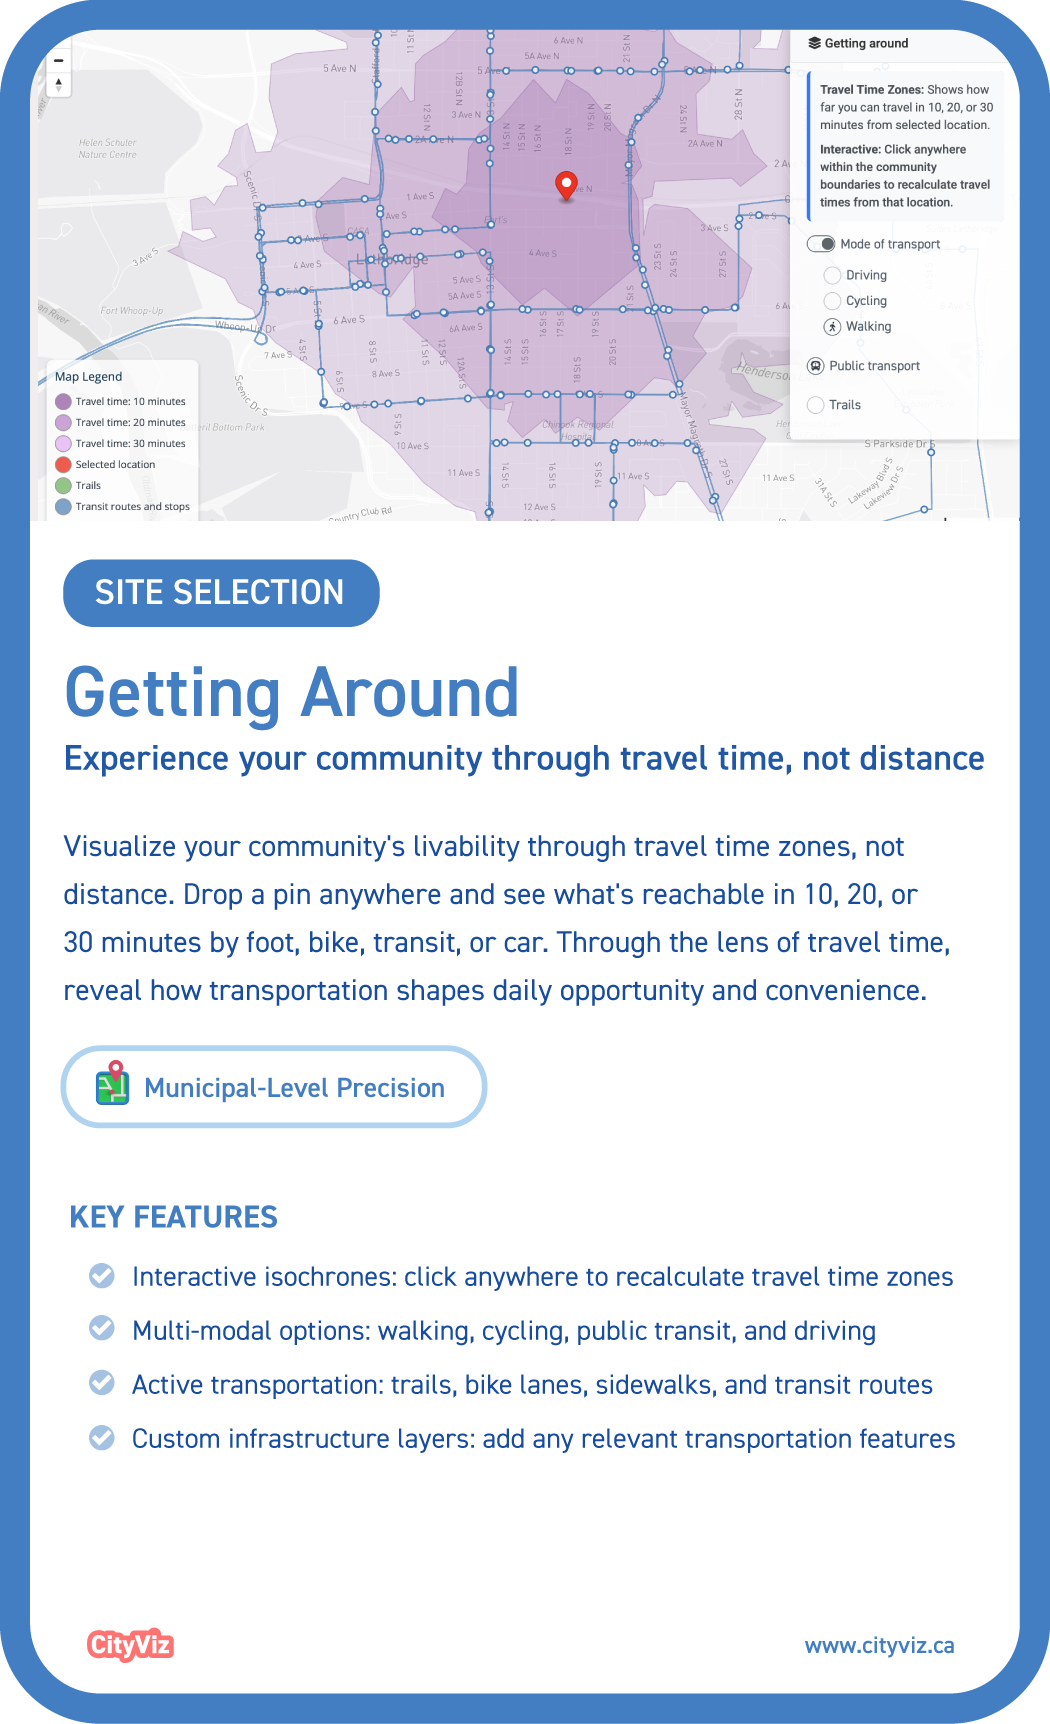
Getting Around
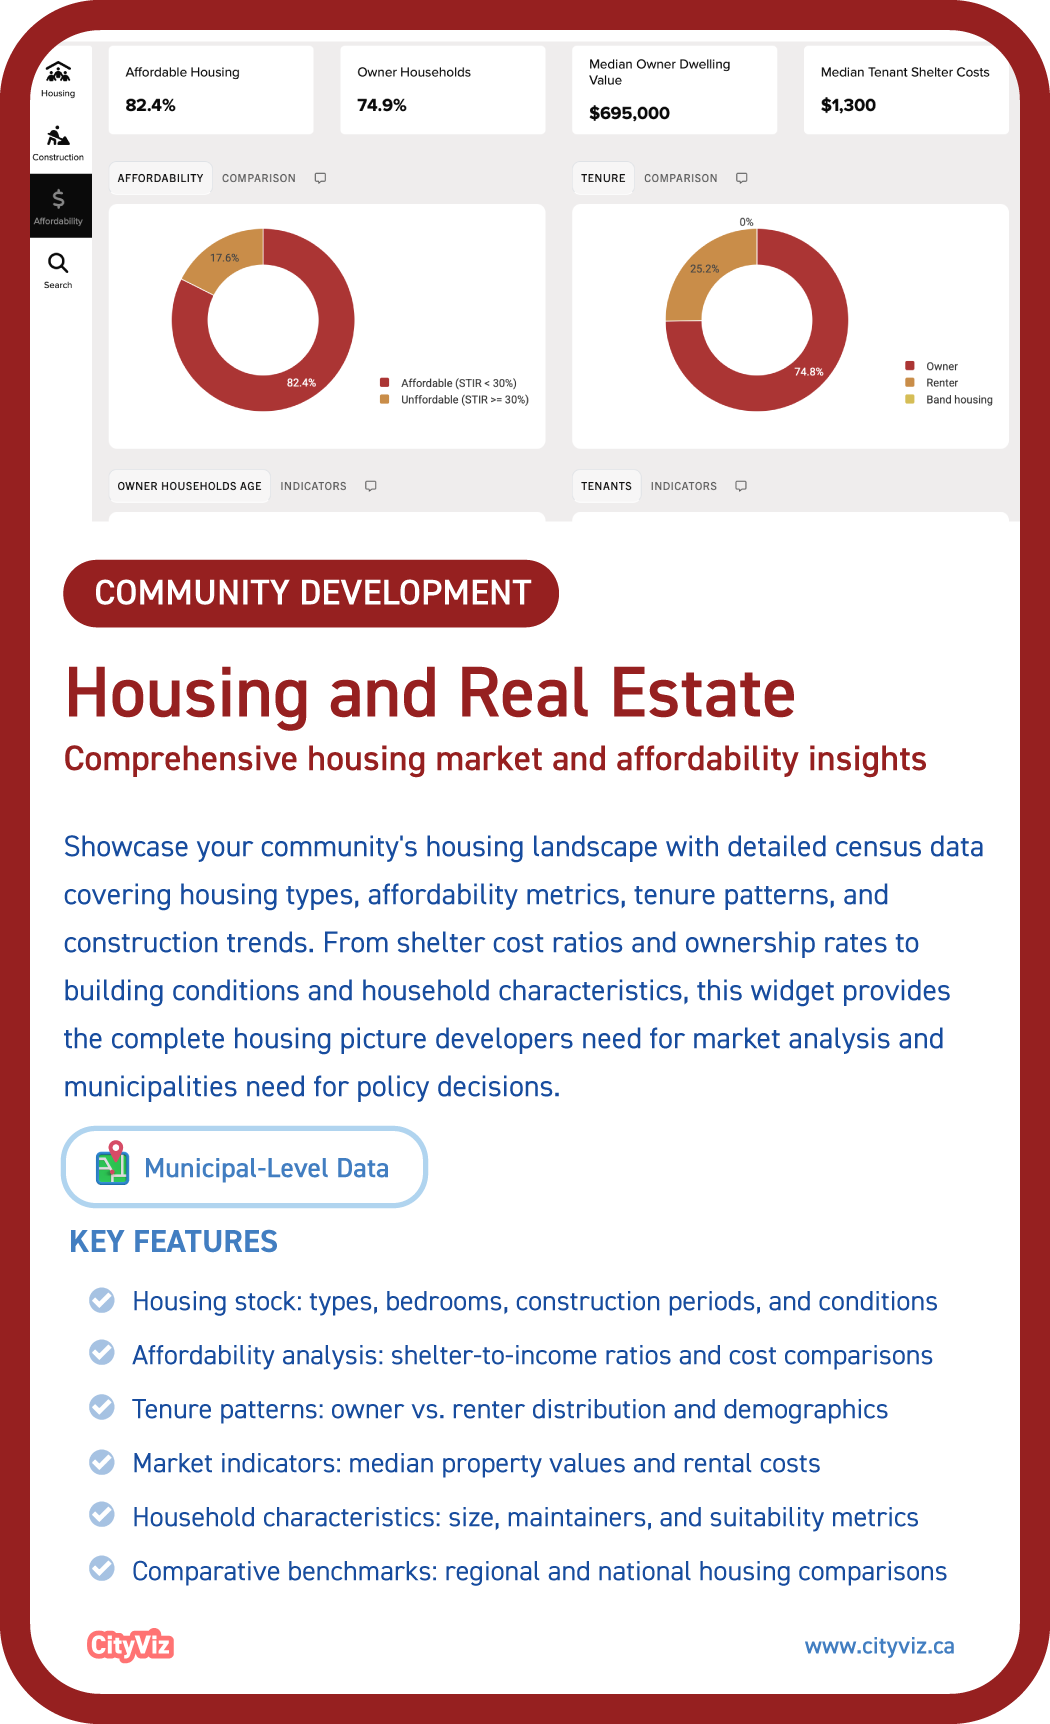
Housing Profile
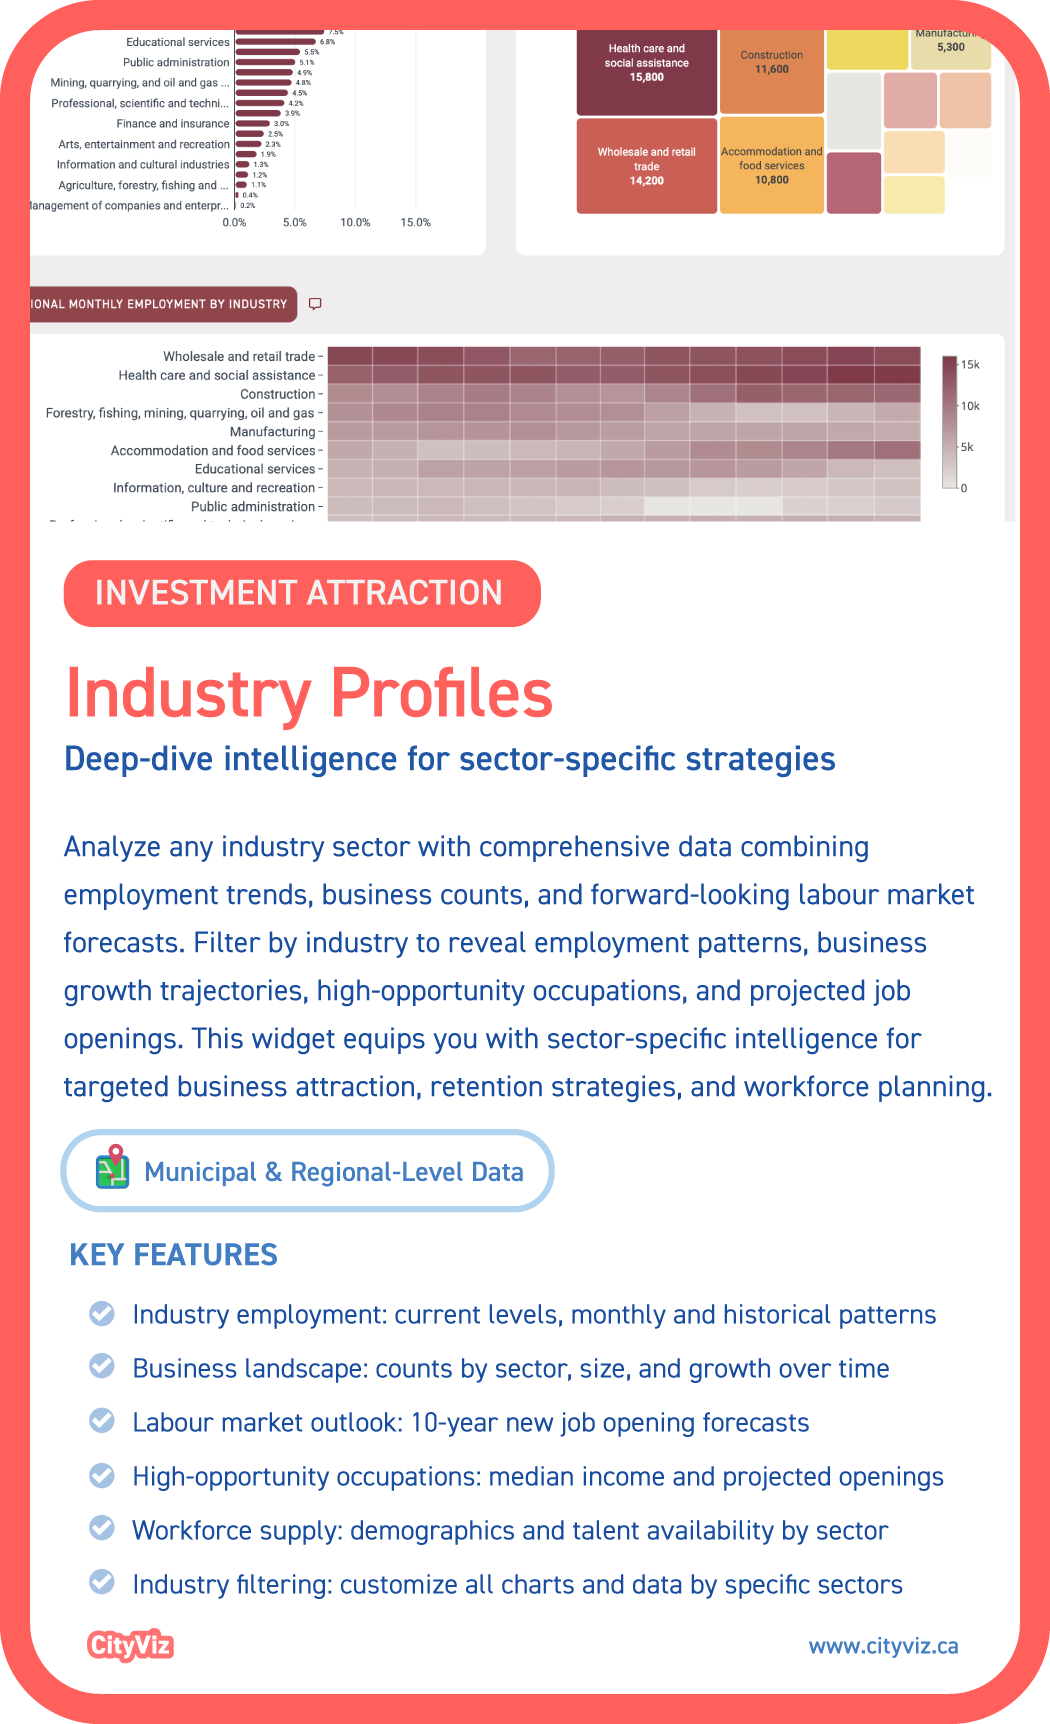
Industry Profiles
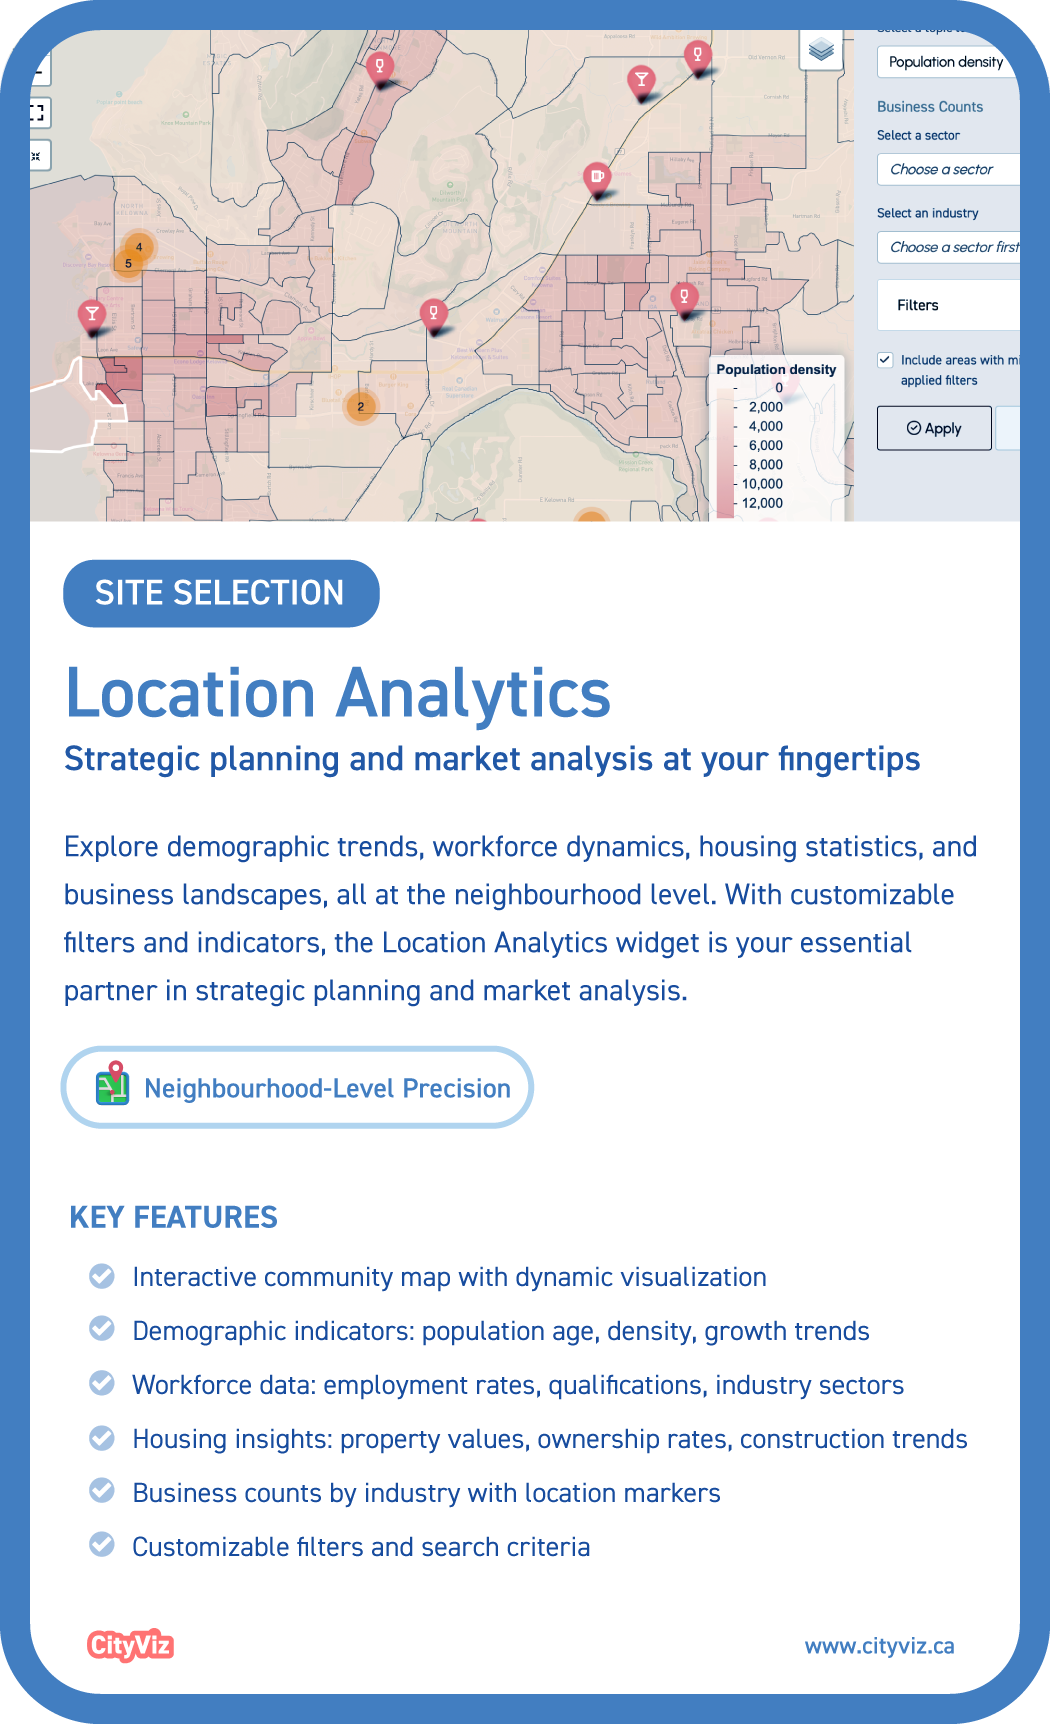
Location Analytics
Transportation
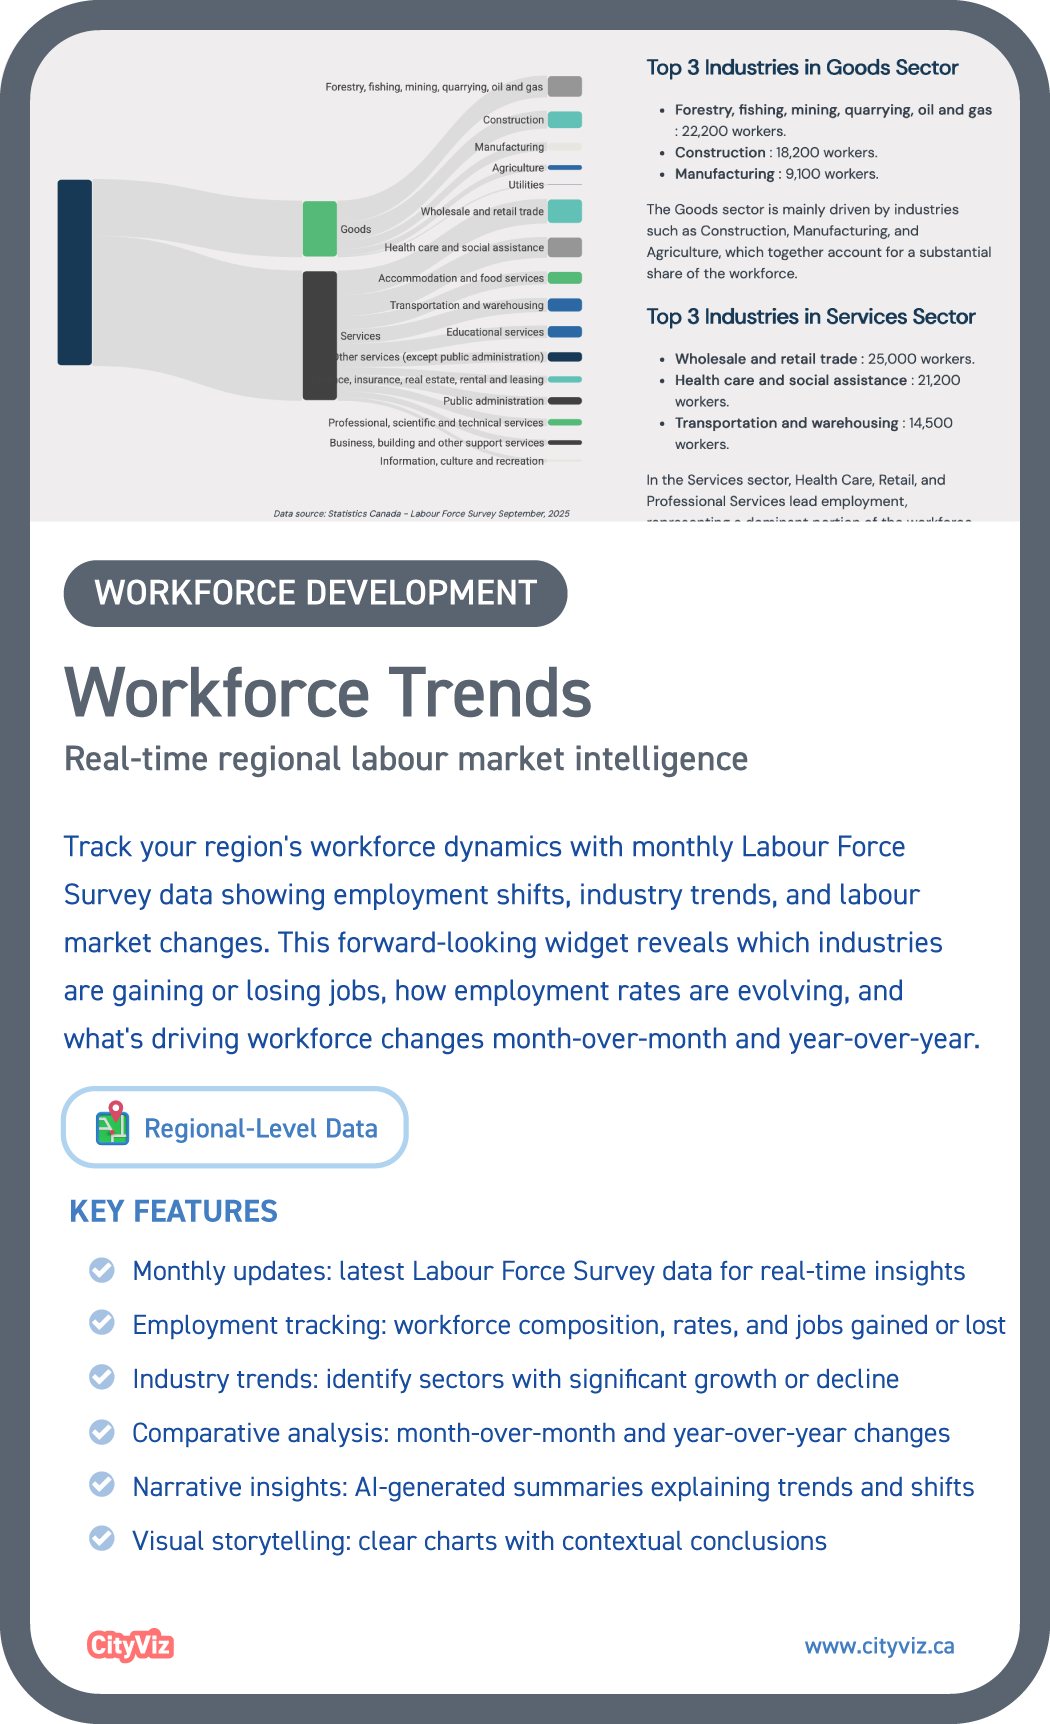
Workforce Trends
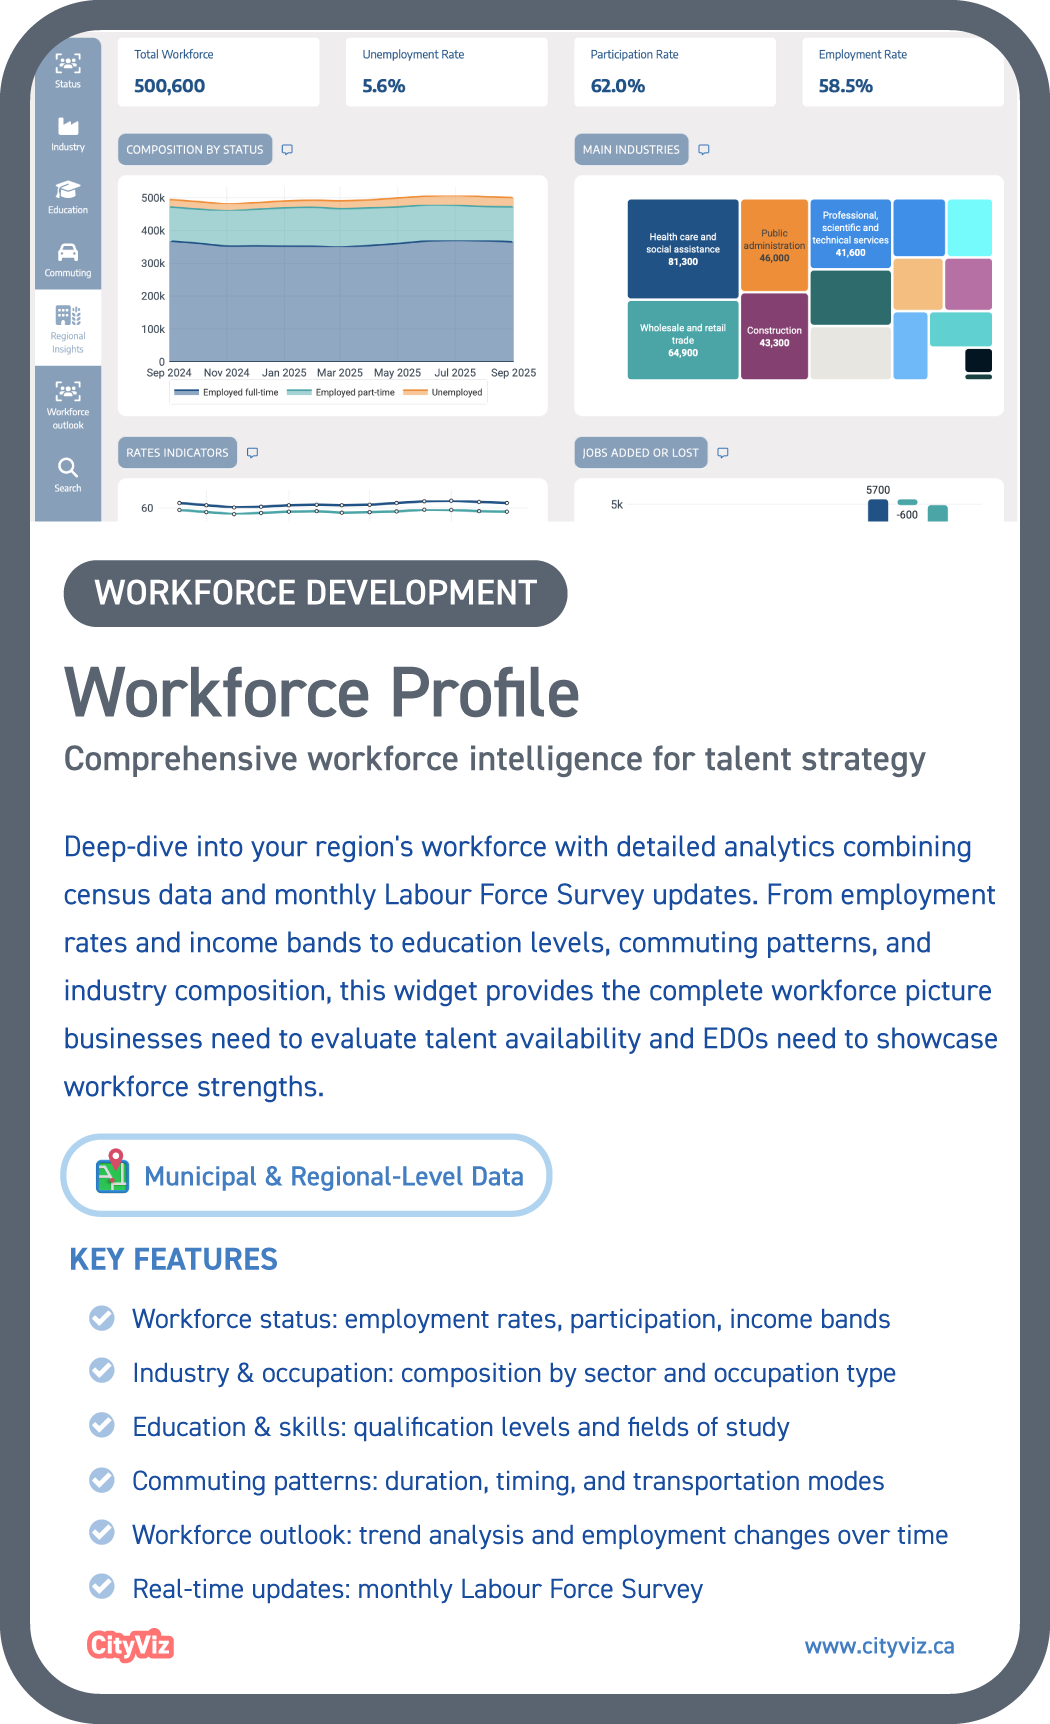
Workforce Profile
Comprehensive workforce intelligence for talent strategy
Deep-dive into your region's workforce with detailed analytics combining census data and monthly Labour Foce Survey updates. From employment rates and income bands to education levels, commuting patterns and industry composition, this widget provides the complete workforce picture businesses need to evaluate talent availability and EDOs need to showcase workforce strengths.
- Workforce status: employment rates, participation, income bands
- Industry& occupation: composition by sector and occupation type
- Education & skills: qualification levels and fields of study
- Commuting patterns: duration, timing, and transportation modes
- Workforce outlook: trend analysis and employment changes over time
- Real-time updates: monthly Labour Force Survey.
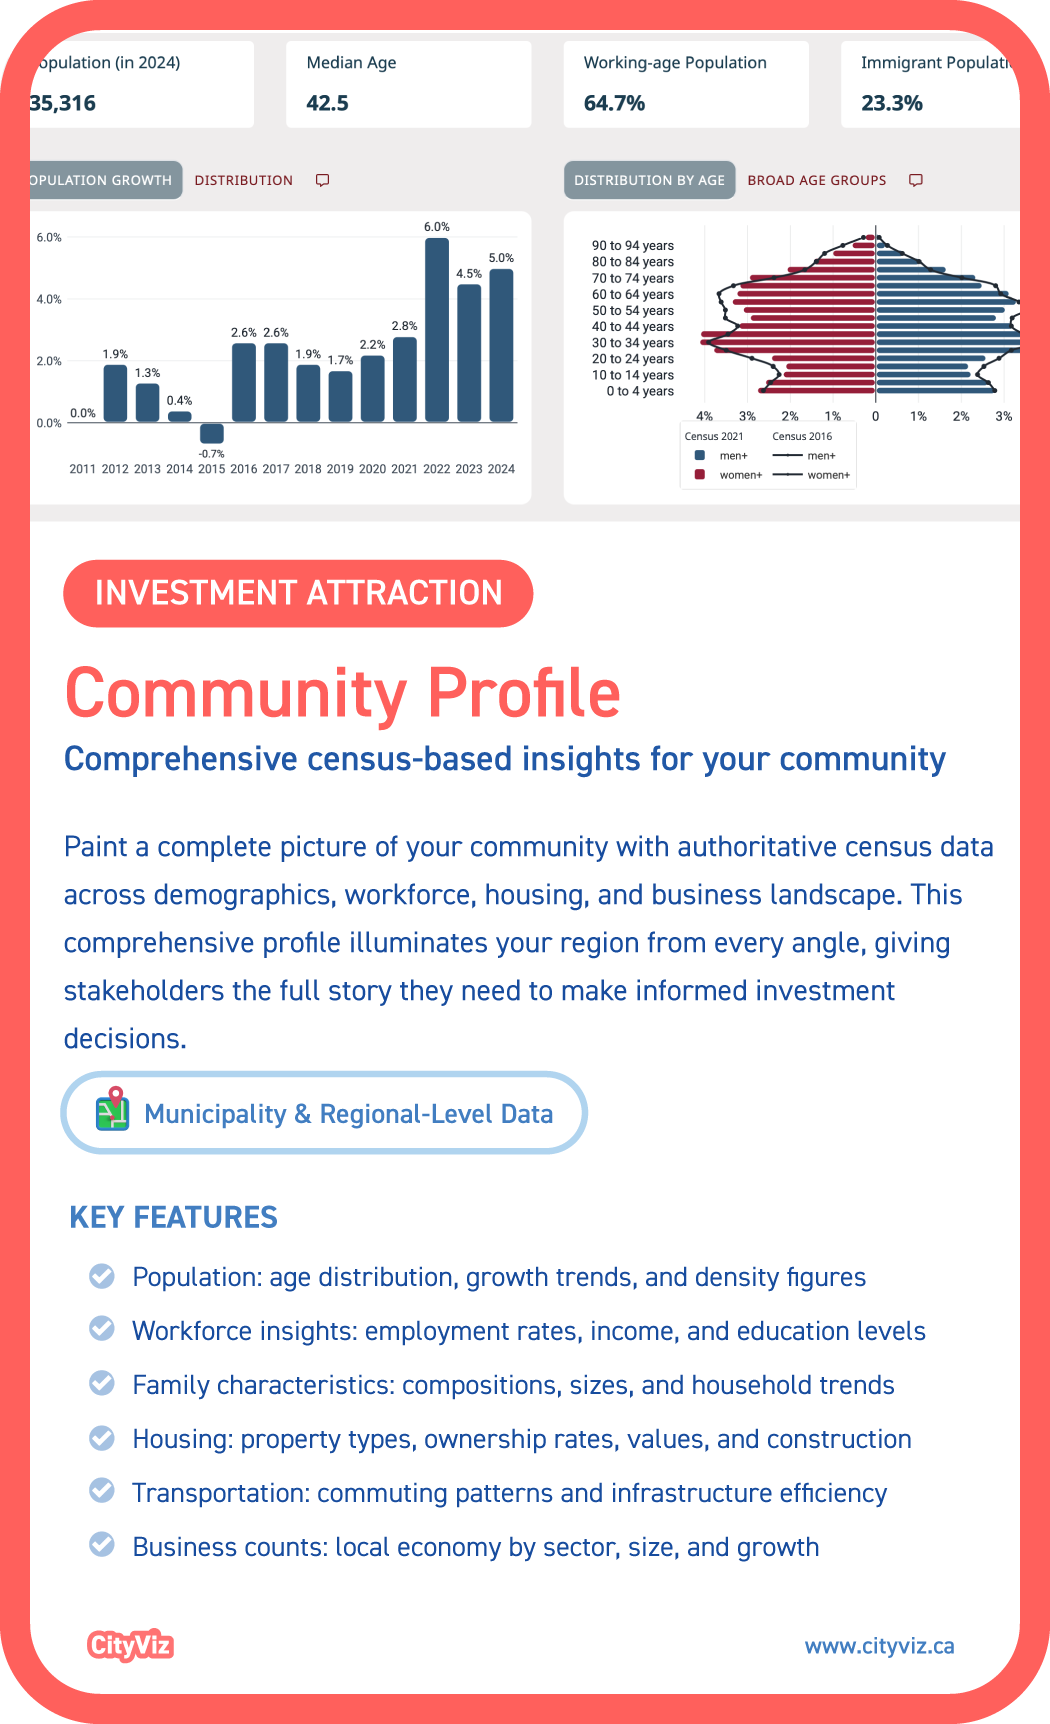
Community Profile
Comprehensive census-based insights for your community.
Paint a complete picture of your community with authoritative census data across demographics, workforce, housing, and business landscape. This comprehensive profile illuminates your region from every angle, giving stakeholders the full story they need to make informed investment decisions.
- Population: age distribution, growth trends, and density figures
- Workforce insights: emplyment rates, income, and education levels.
- Family characteristics: compositions, sizes, and household trends
- Housing: property types, ownership rates, values, and construction
- Transportation: commuting patterns and infrastructure efficiency
- Business counts: local economy by sector, size, and growth.
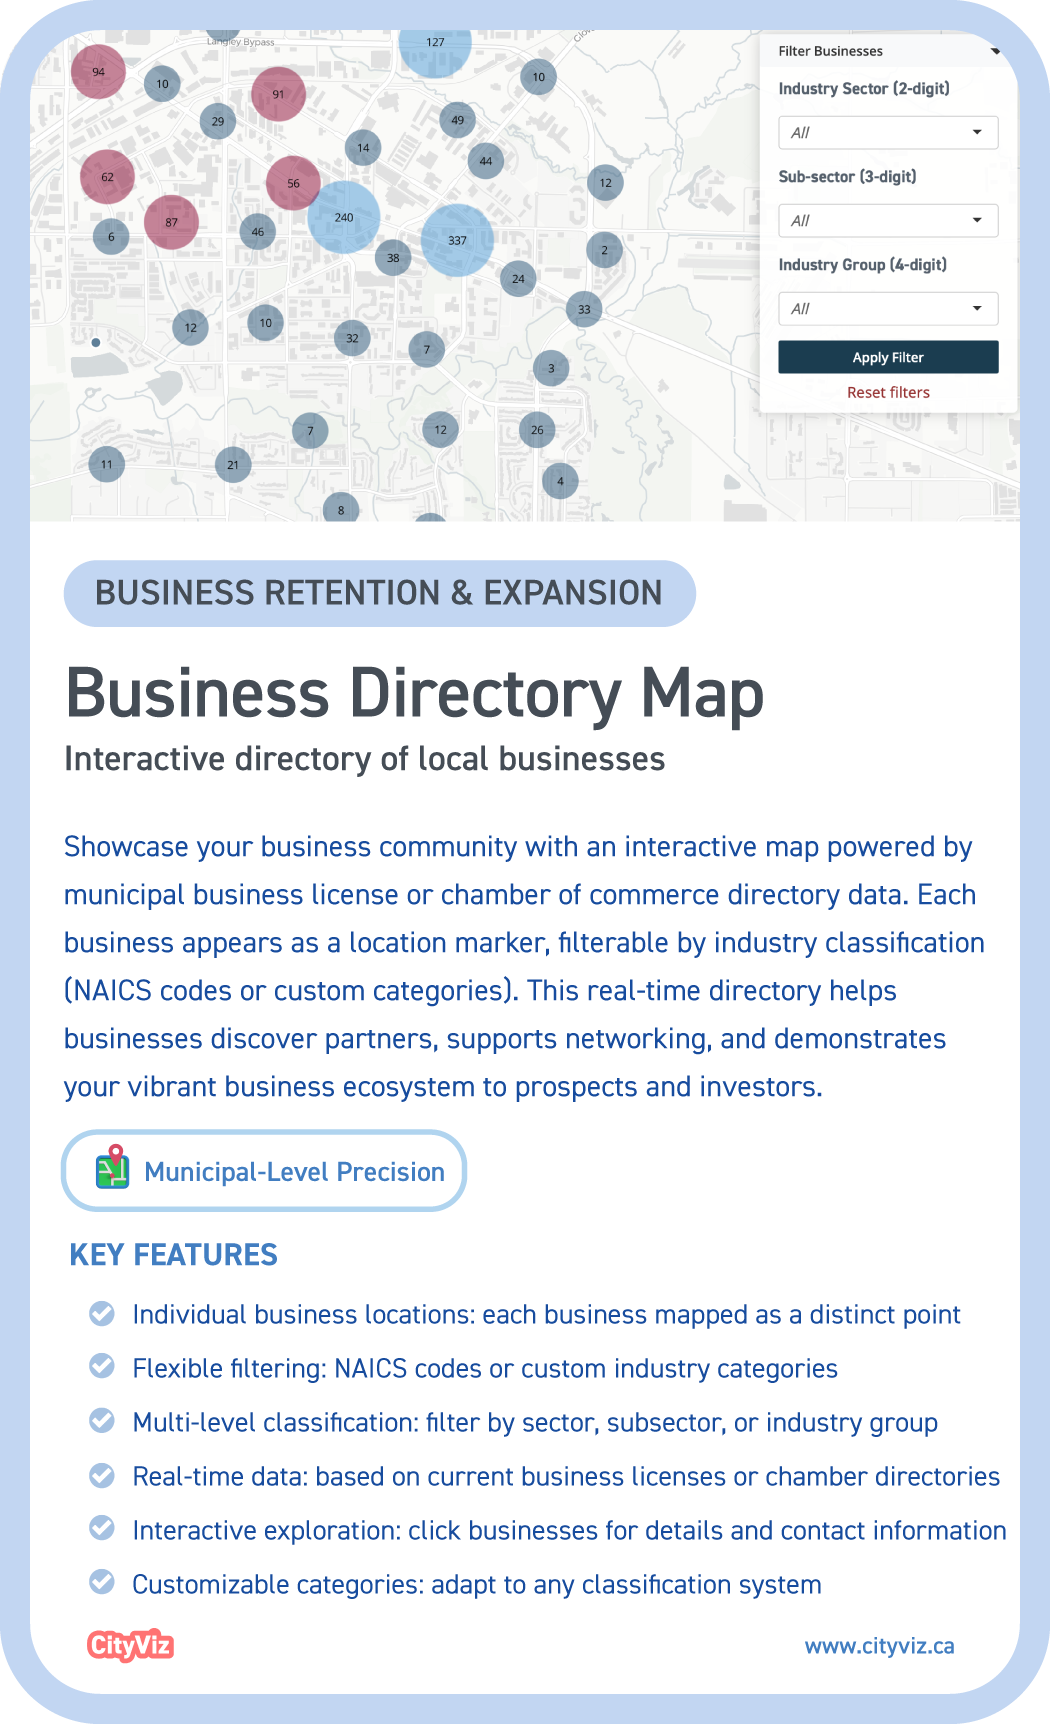
Business Directory Map
Interactive directory of local businesses
Showcase your business community with an interactive map powered by municipal business license or chamber of commerce directory data. Each business appears as a location marker, filterable by industry classification (NAICS codes or custom categories). This real-time directory helps businesses discover partners, supports networking, and demonstrates your vibrant business ecosystem to prospects and investors.
- Individual business locations: each business mapped as a distinct point
- Flexible filtering: NAICS codes or custom industry categories
- Multi-level classsification: filter by sector, subsector, or industry group
- Real-time data: based on current business licenses or chamber directories
- Interactive exploration: click businesses for details and contact information
- Customizable categories: adapt to any classification system.
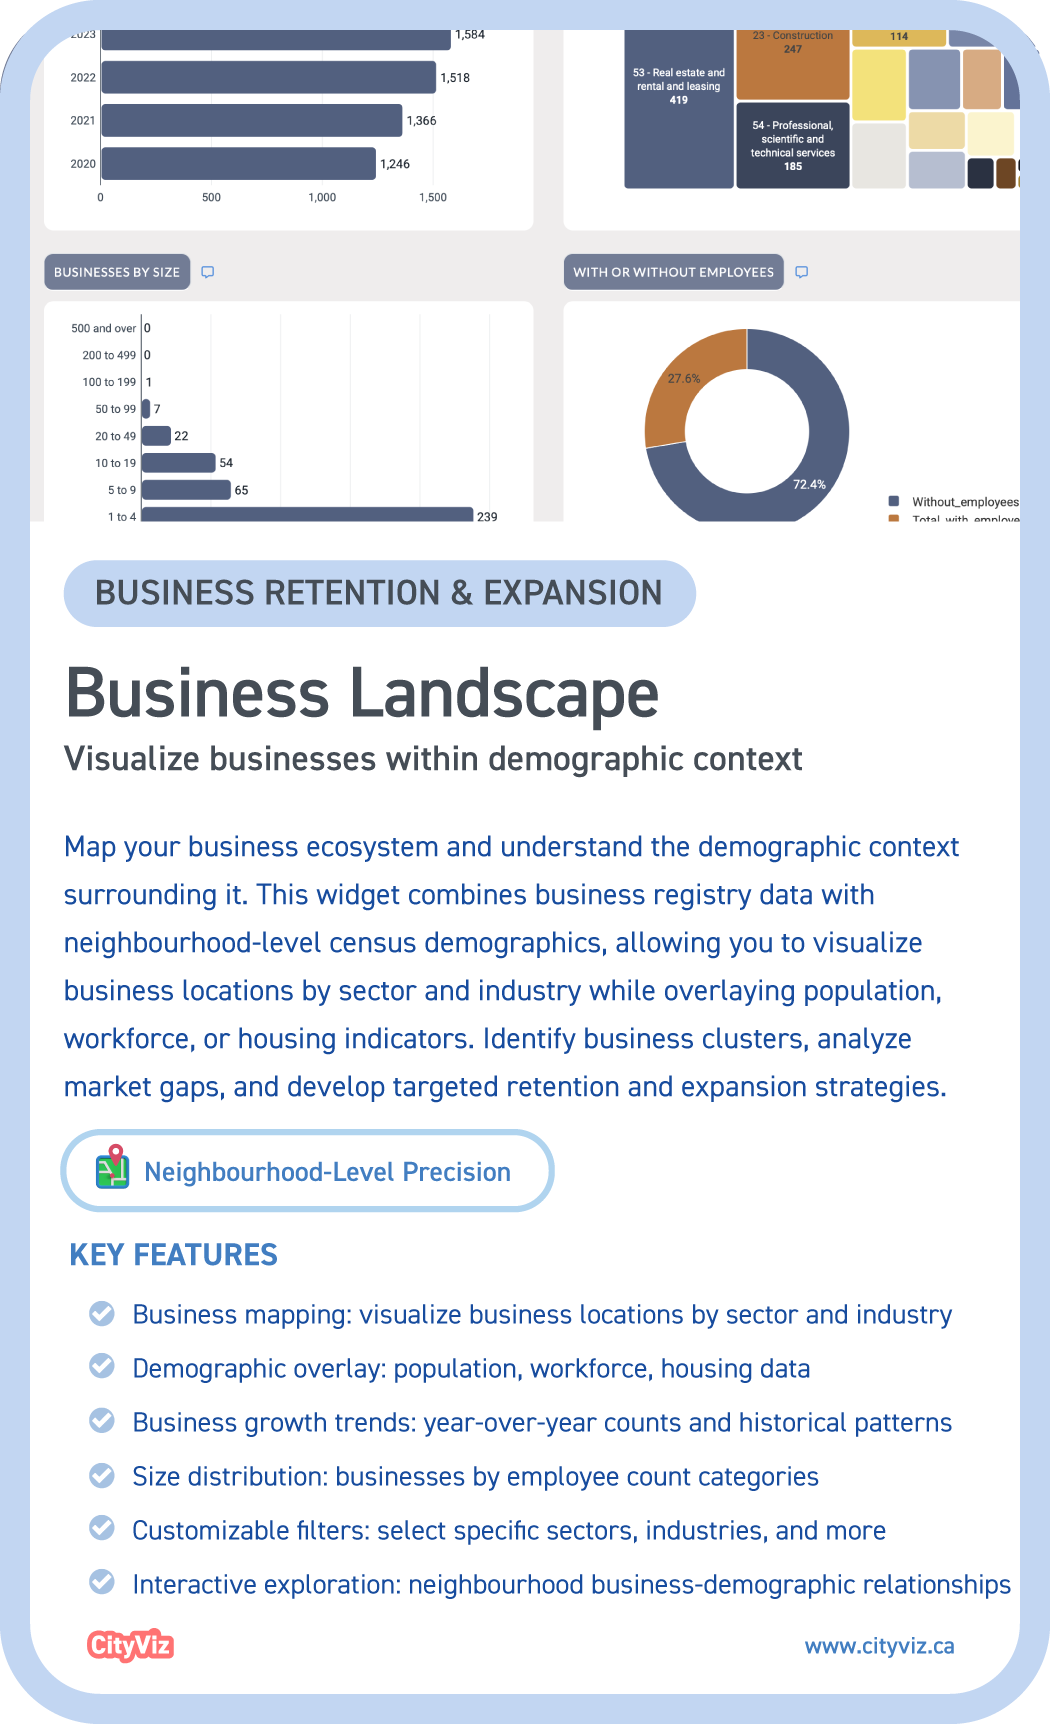
Business Landscape
Visualize businesses within demographic context
Map your business ecosystem and understand the demographic context surrounding it. This widget combines business registry data with neighbourhood-level census demographics, allowing you to visualize business locations by sector and industry while overlaying population, workforce, or housing indicators. Identify business clusters, analyze market gaps, and develop targeted retention and expansion strategies.
- Business mapping: visualize business locations by sector and industry
- Demographic overlay: population, workforce, housing data
- Business growth trends: year-over-year counts and historical patterns
- Size distribution: businesses by employee count categories
- Customizable filters: select specific sectors, industries, and more
- Interactive exploration: neighbourhood business-demographic relationships
Commercial Listings
Real estate opportunities meet location intelligence
Showcase available commercial properties and land with detailed MLS listings integrated via Spacelist. Each listing includes images, descriptions, floor plans, and agent contact information-all mapped and layered with existing business locations and demographic data. Help prospects visualize not just the property, but the complete market context surrounding it for informed site selection decisions.
-
Interactive property mapping: plot commercial listings with overlays
-
Comprehensive listings: images, descriptions, floor plans, and multimedia
- Agent contact details: direct access to listing agents
- Demographic context: overlay population, workforce, or housing data
- Business proximity: visualize nearby businesses by sector and industry
- Integrated intelligence: combine real estate data with economic indicators
Economic Indicators Dashboard
Real-time economic insights at your fingertips
Track your community's economic pulse with current data on key indicators including population growth, employment rates, housing starts, business activity, and more. With visual storytelling through annotated charts and benchmarking against comparable communities, this dashboard transforms data into actionable intelligence for strategic decision-making.
- Current values and trends: latest data points with clear visualizations
- Visual storytelling: annotated charts explaining shifts and trends
- Benchmarking: comparative analysis against other cities and regions
- Custom data integration: building permits, business licenses, tourism data
- Downloadable reports: generate PDF, Word, or PowerPoint presentations
Real-time updates: always current information for informed decisions